

Most of the QGIS scripts on this site do one job well. This post is different — it walks through how six of them chain together into a single pipeline that takes you from raw drone imagery to a per-tree health report, illustrated end-to-end on a real coconut plantation survey. If you’ve read the individual script tutorials and wondered “okay, but how do these fit together,” this is that answer.
Where it starts: raw drone data
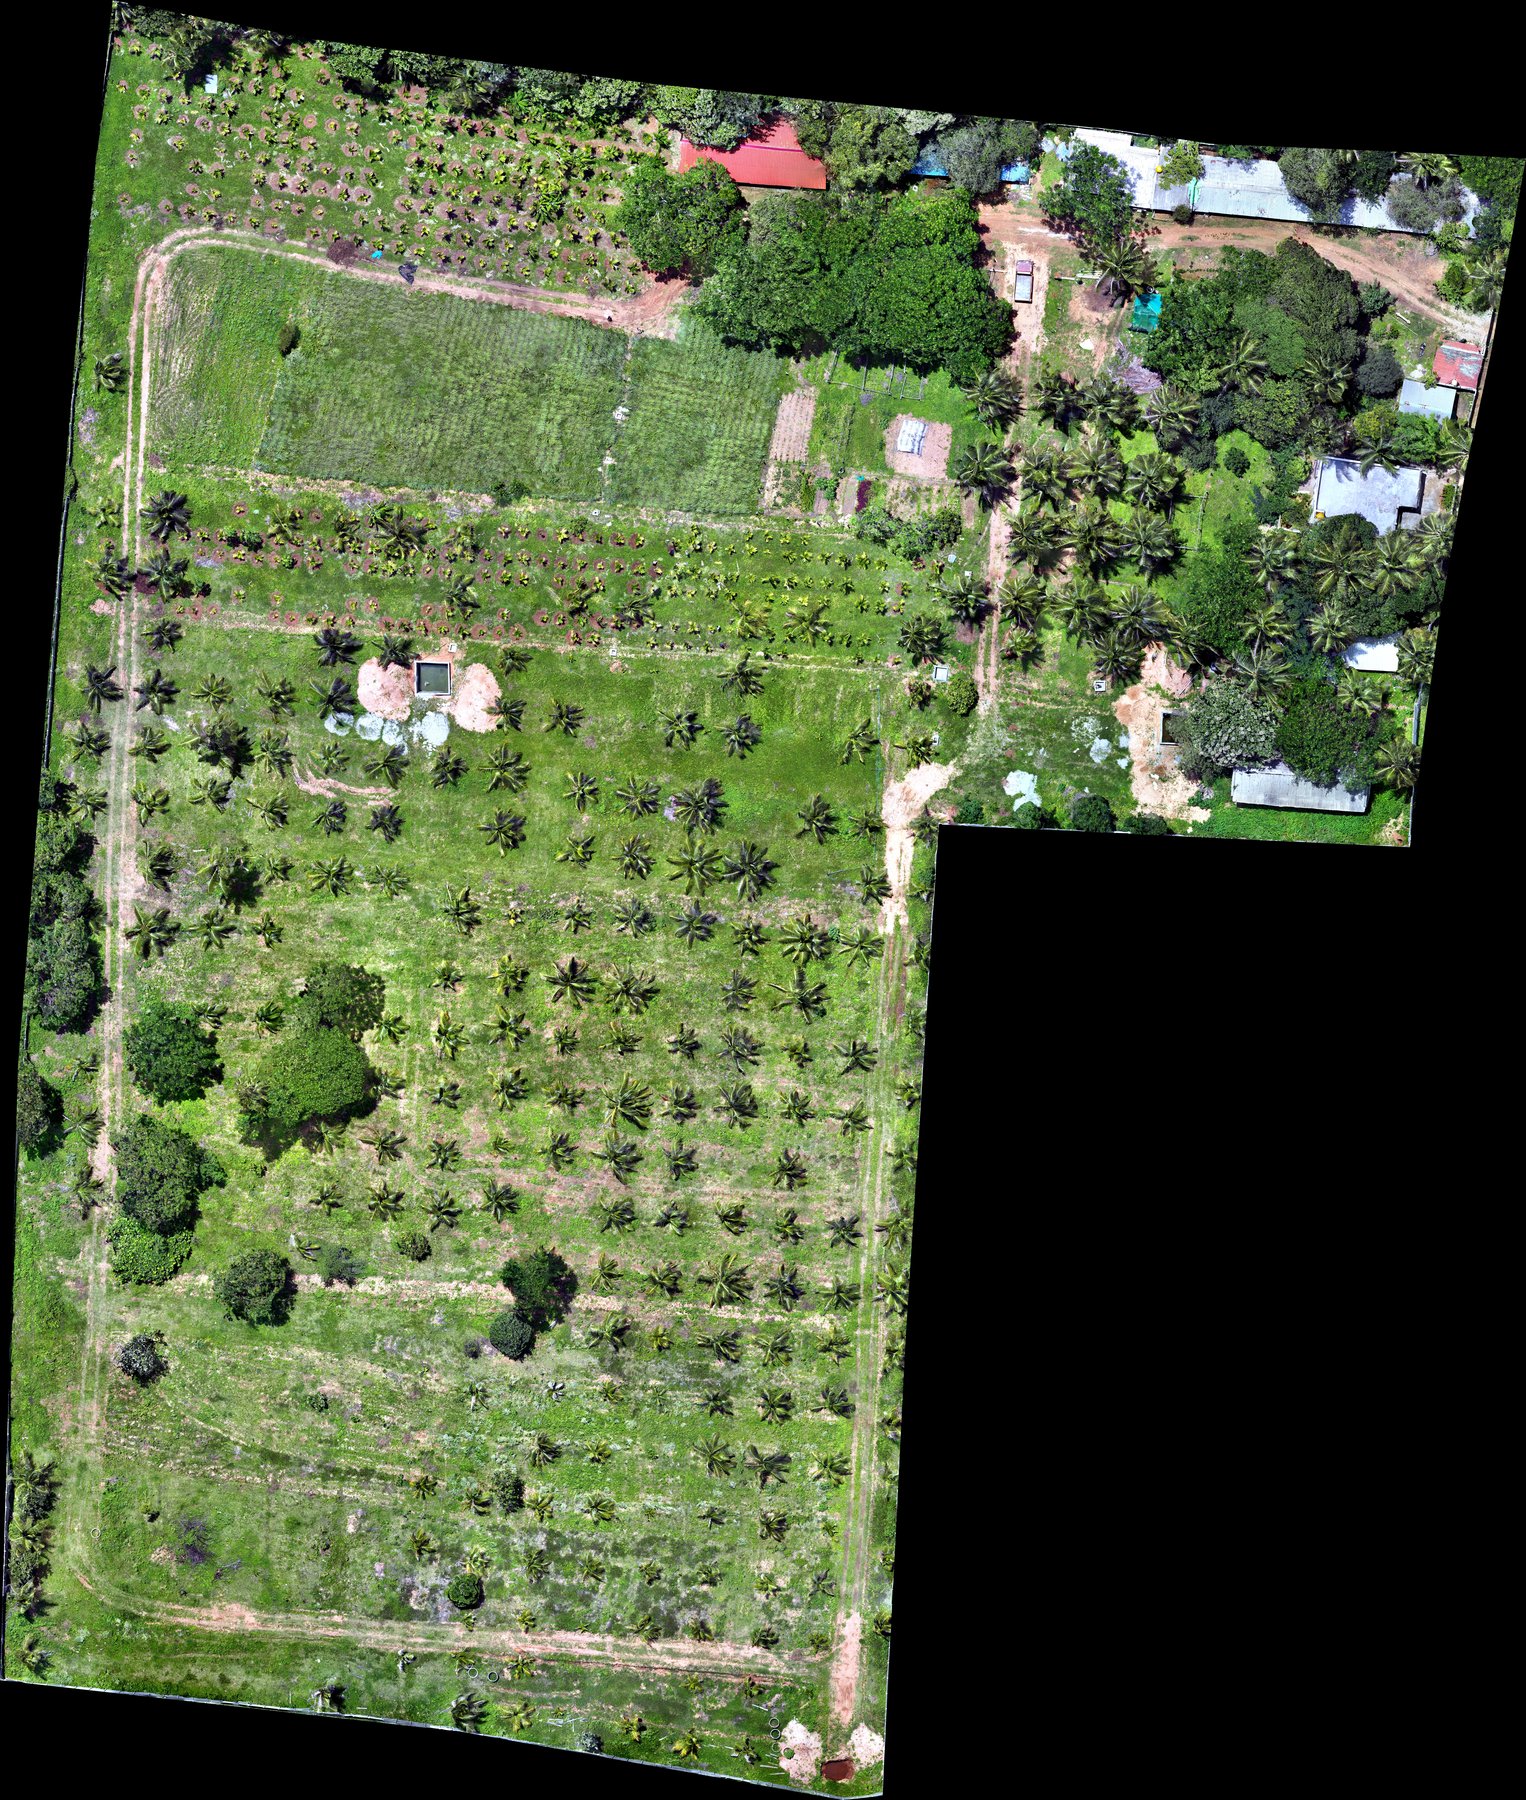
Every project begins with the standard drone deliverables — an RGB orthomosaic, a multispectral orthomosaic, a DSM, and a DTM.
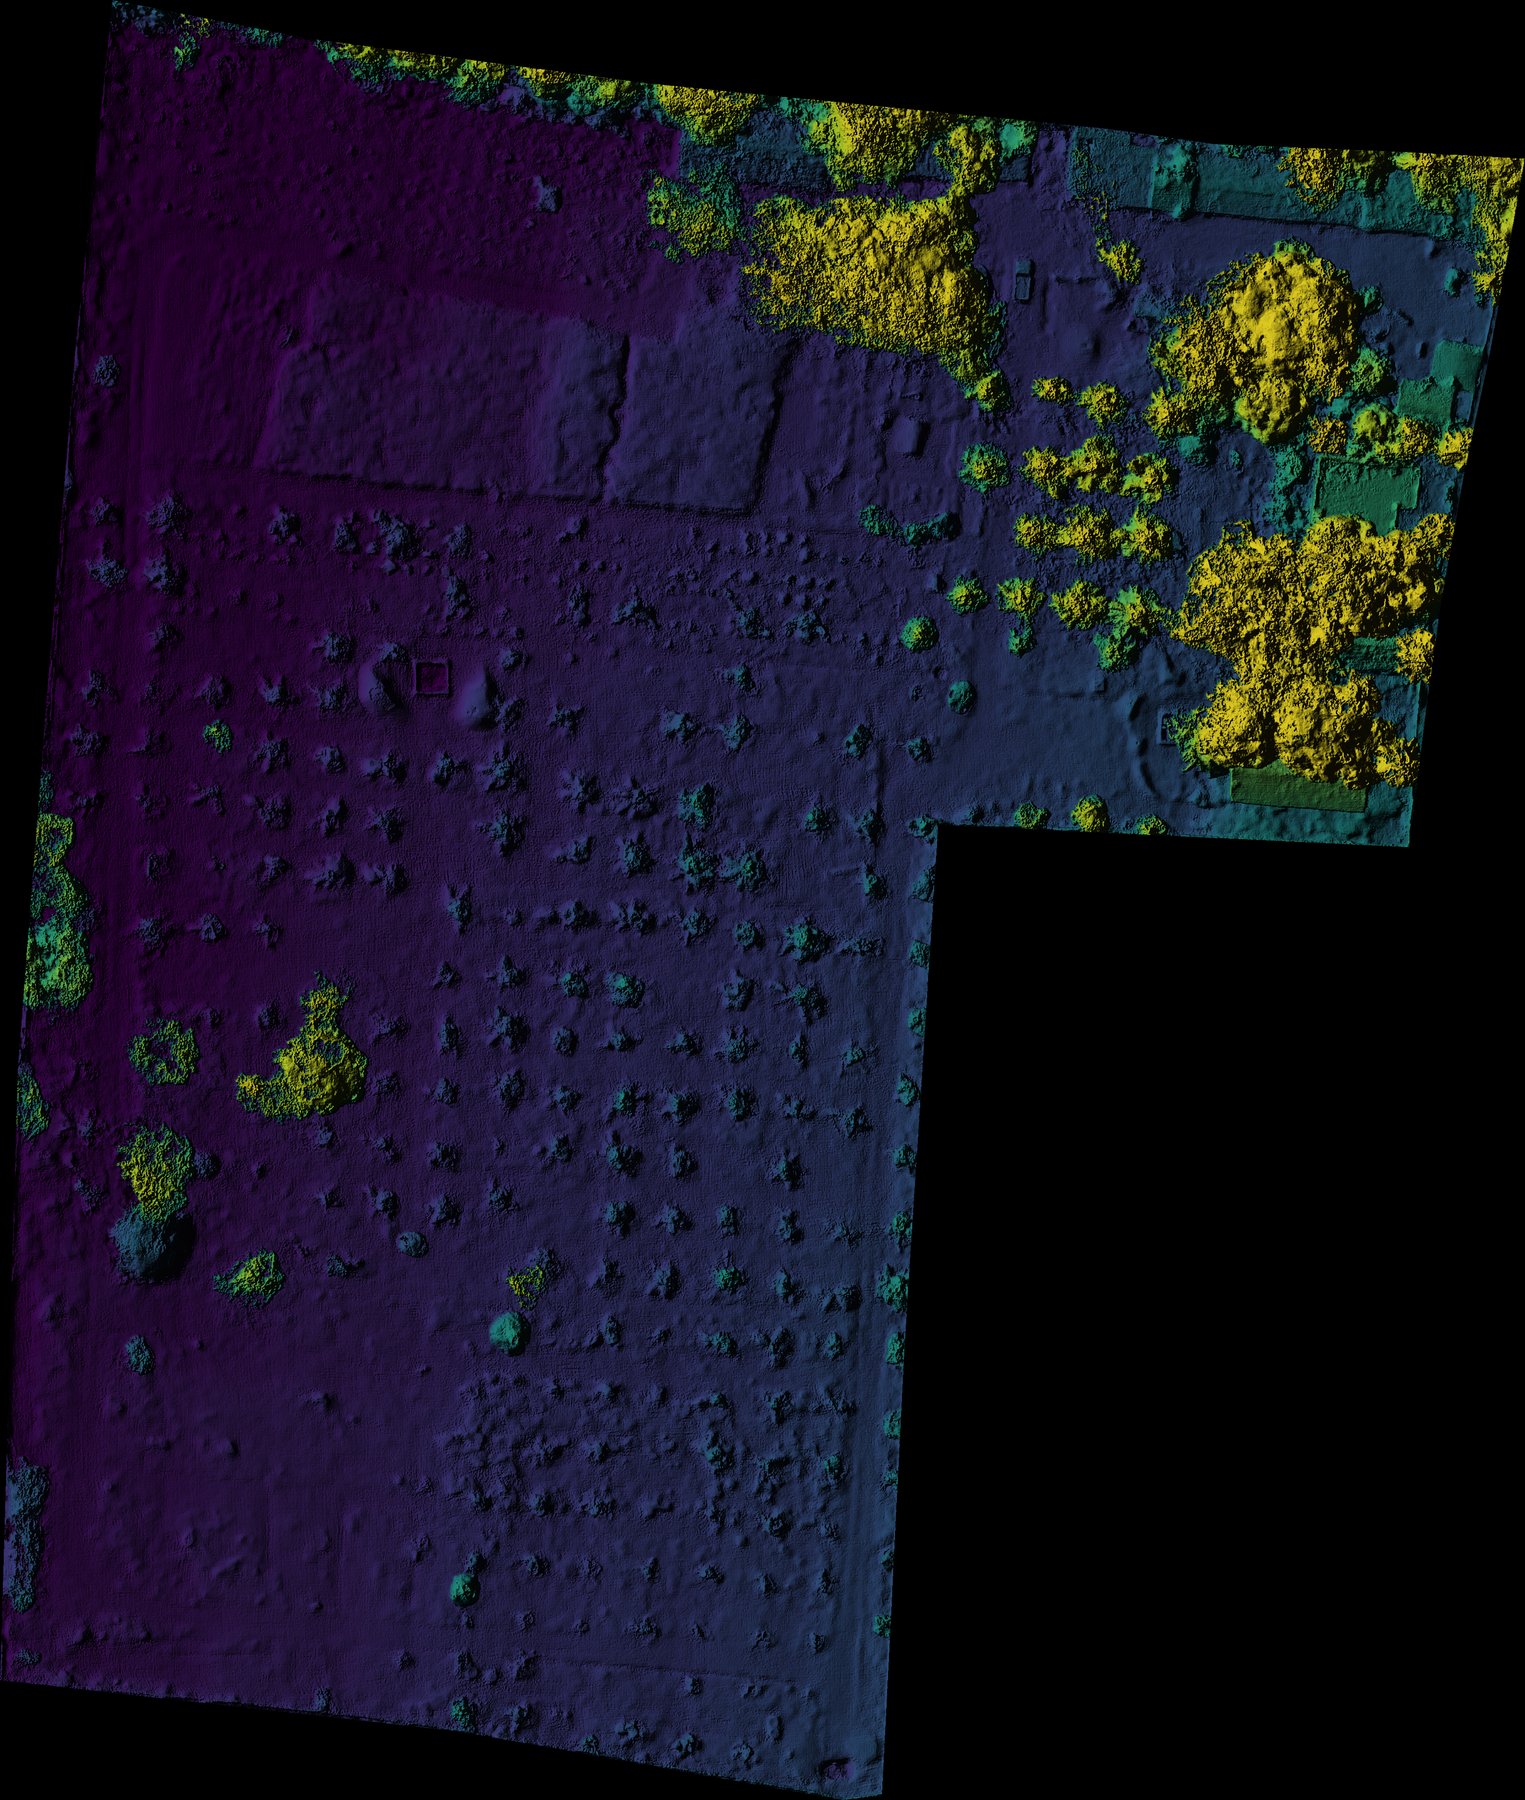
The DSM and DTM get turned into shaded relief so elevation differences — including individual tree canopies — are easy to read visually. DSM (surface, includes canopy):
DTM (bare ground only, canopy removed):
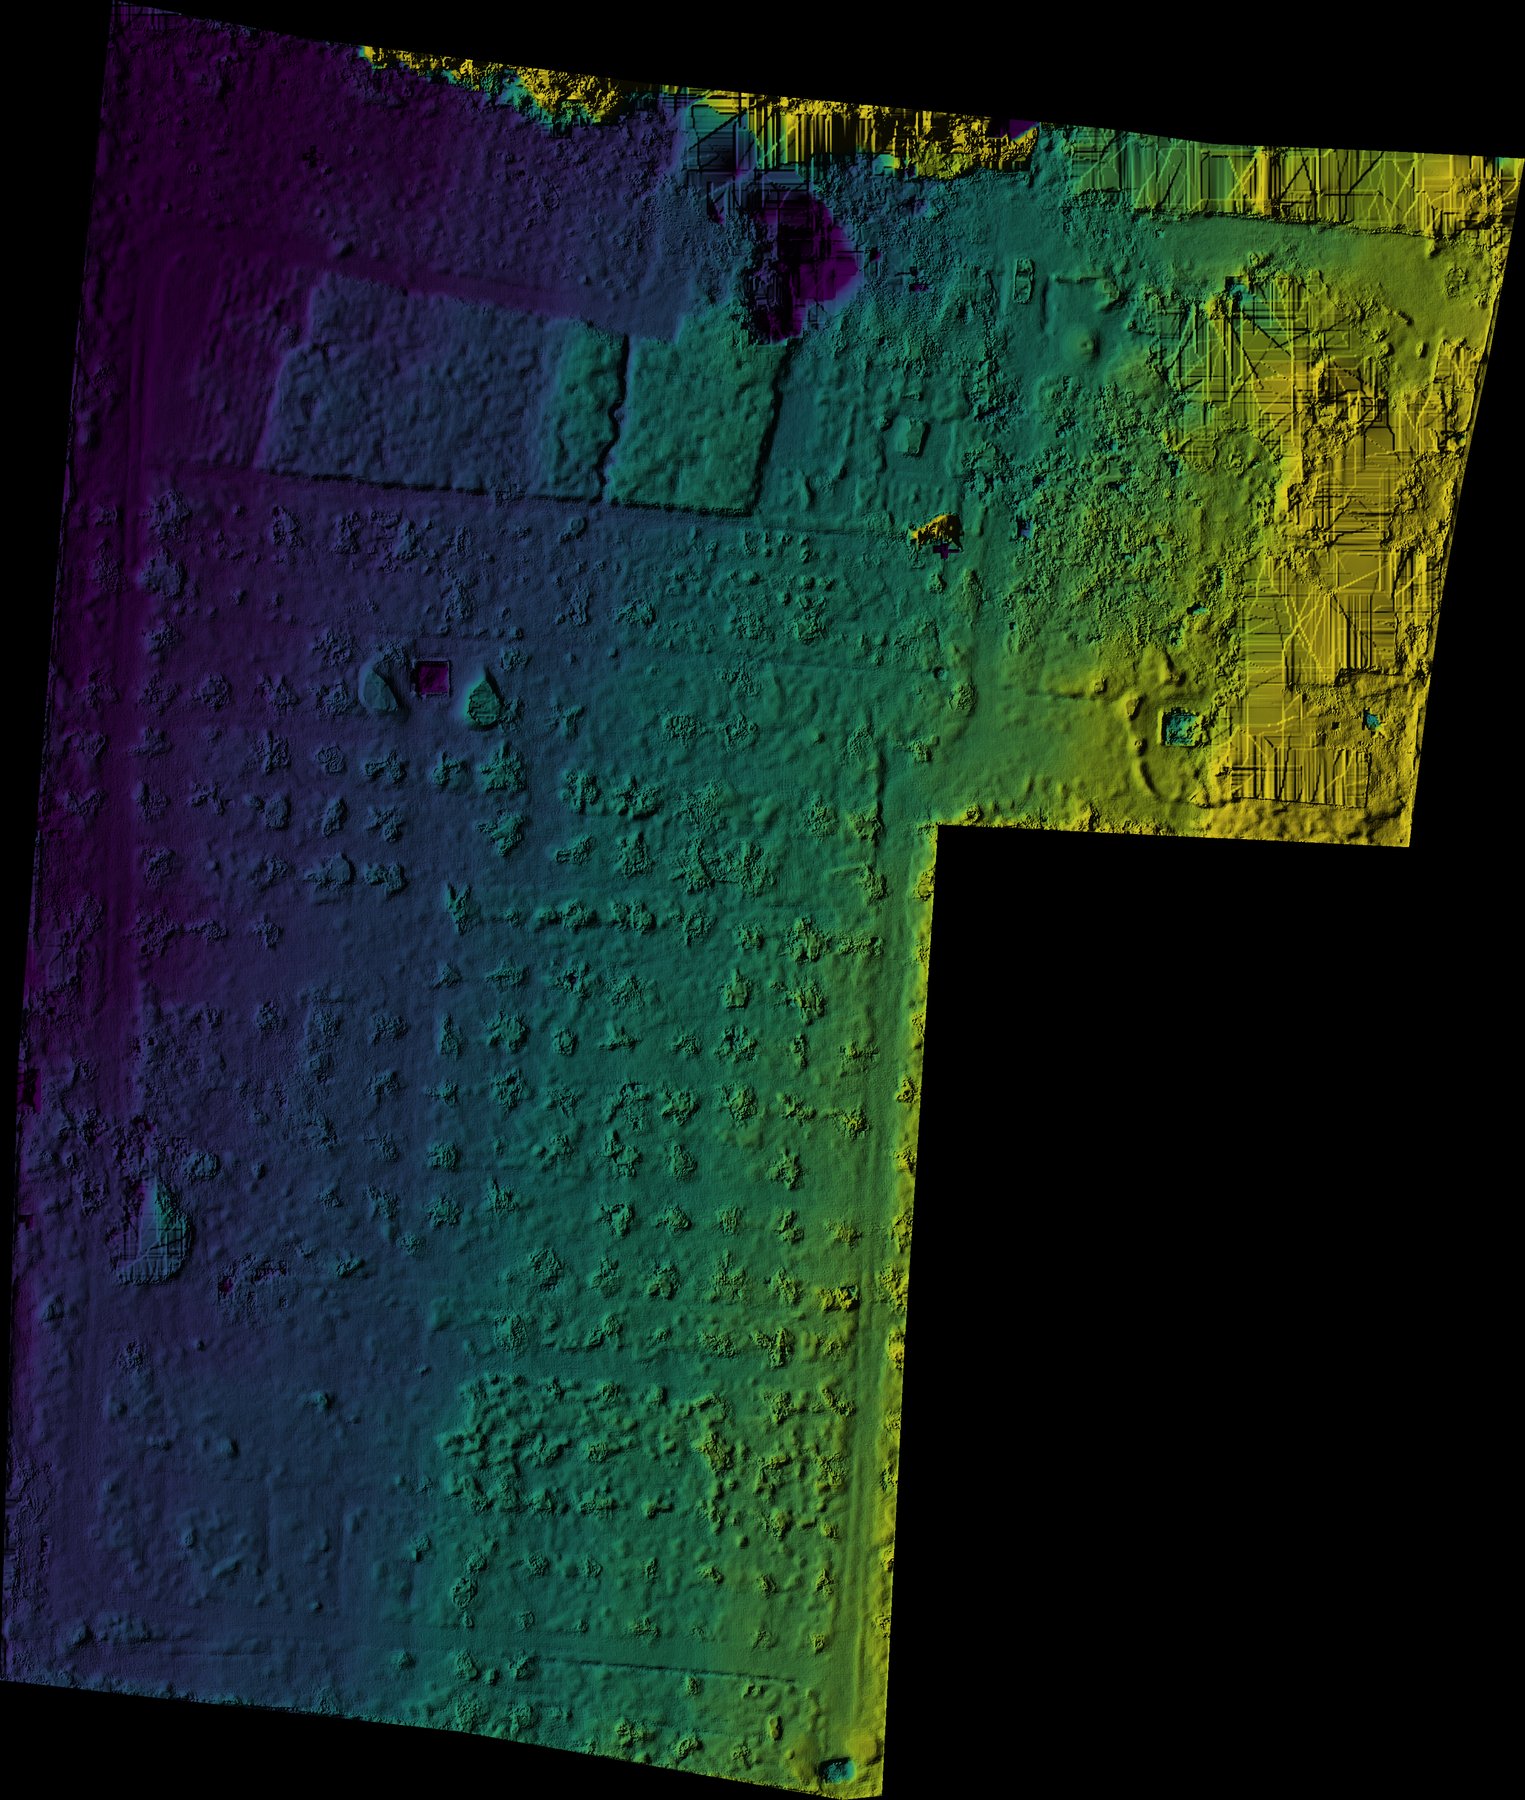
Both generated with generate_hillshade.py — the same coloured-hillshade script used as the base layer throughout this series.
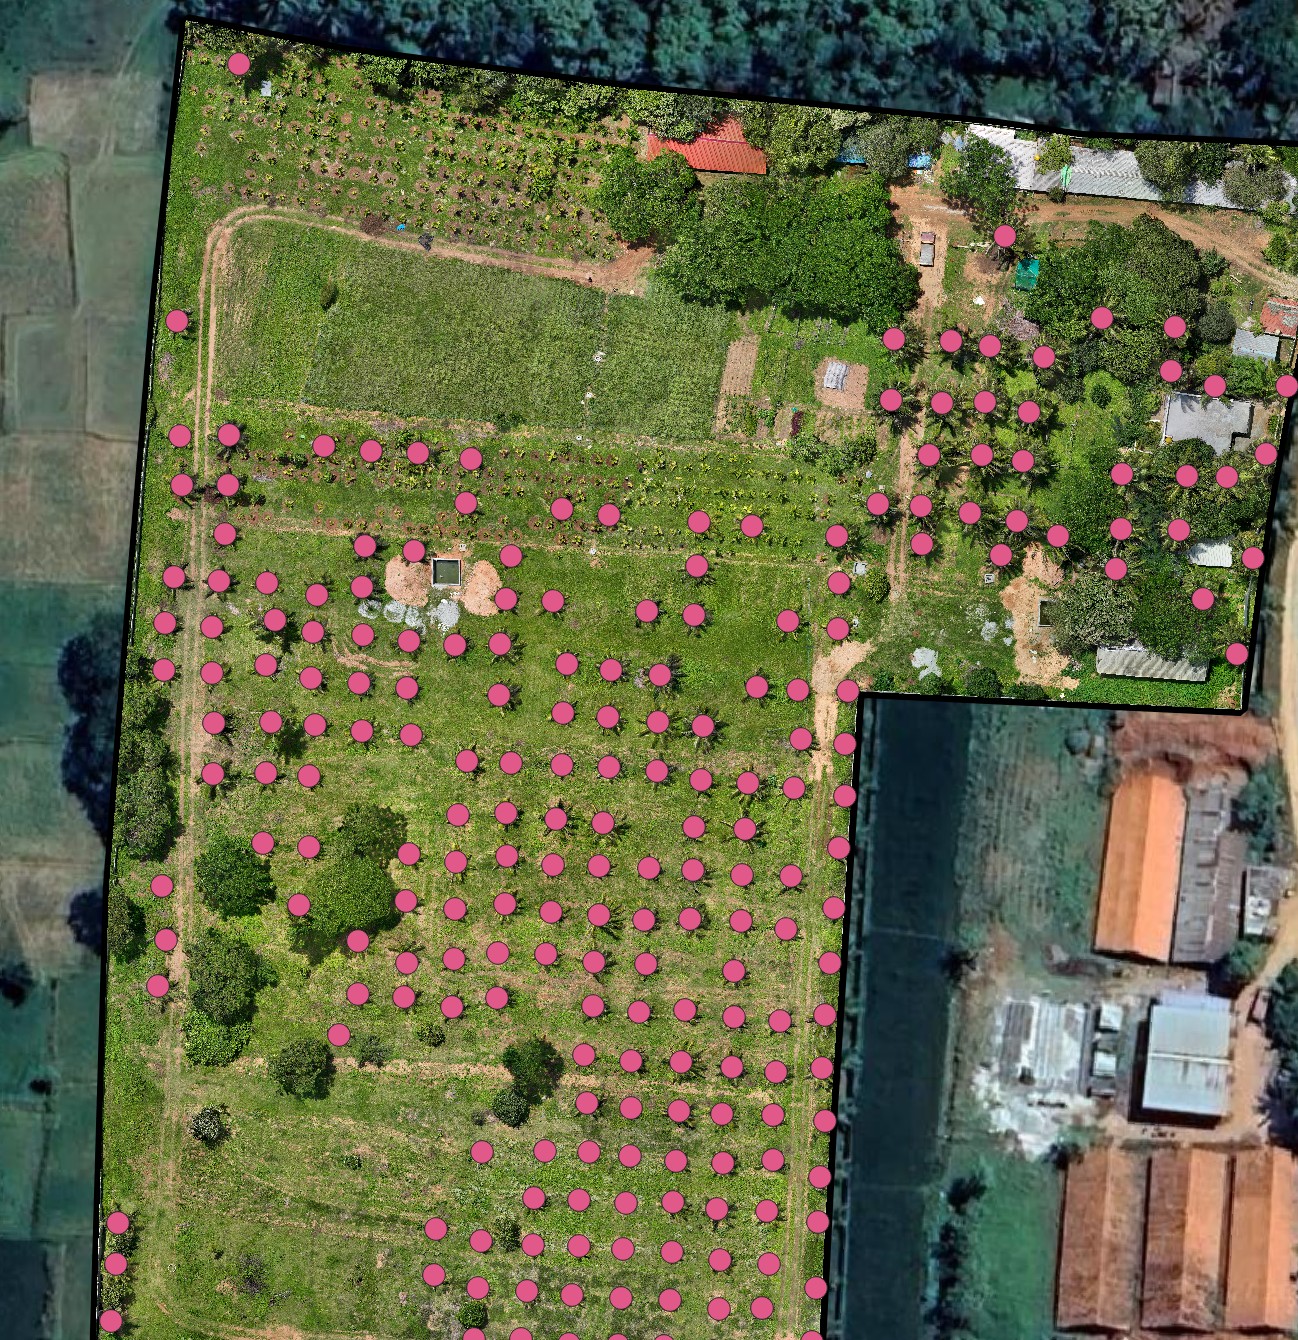
Step 1 — Digitize tree points and the site boundary
This part isn’t scripted — you click each tree trunk in QGIS to place a point, and digitize (or import) the outer site boundary as a polygon. Everything downstream builds on these two layers.
Step 2 — Buffer tree points into crowns
A point has no area, so nothing can be sampled “inside” it. buffer_active_layer.py expands each tree point outward by a fixed radius, turning it into a crown-sized circle — the actual unit every later step measures against.
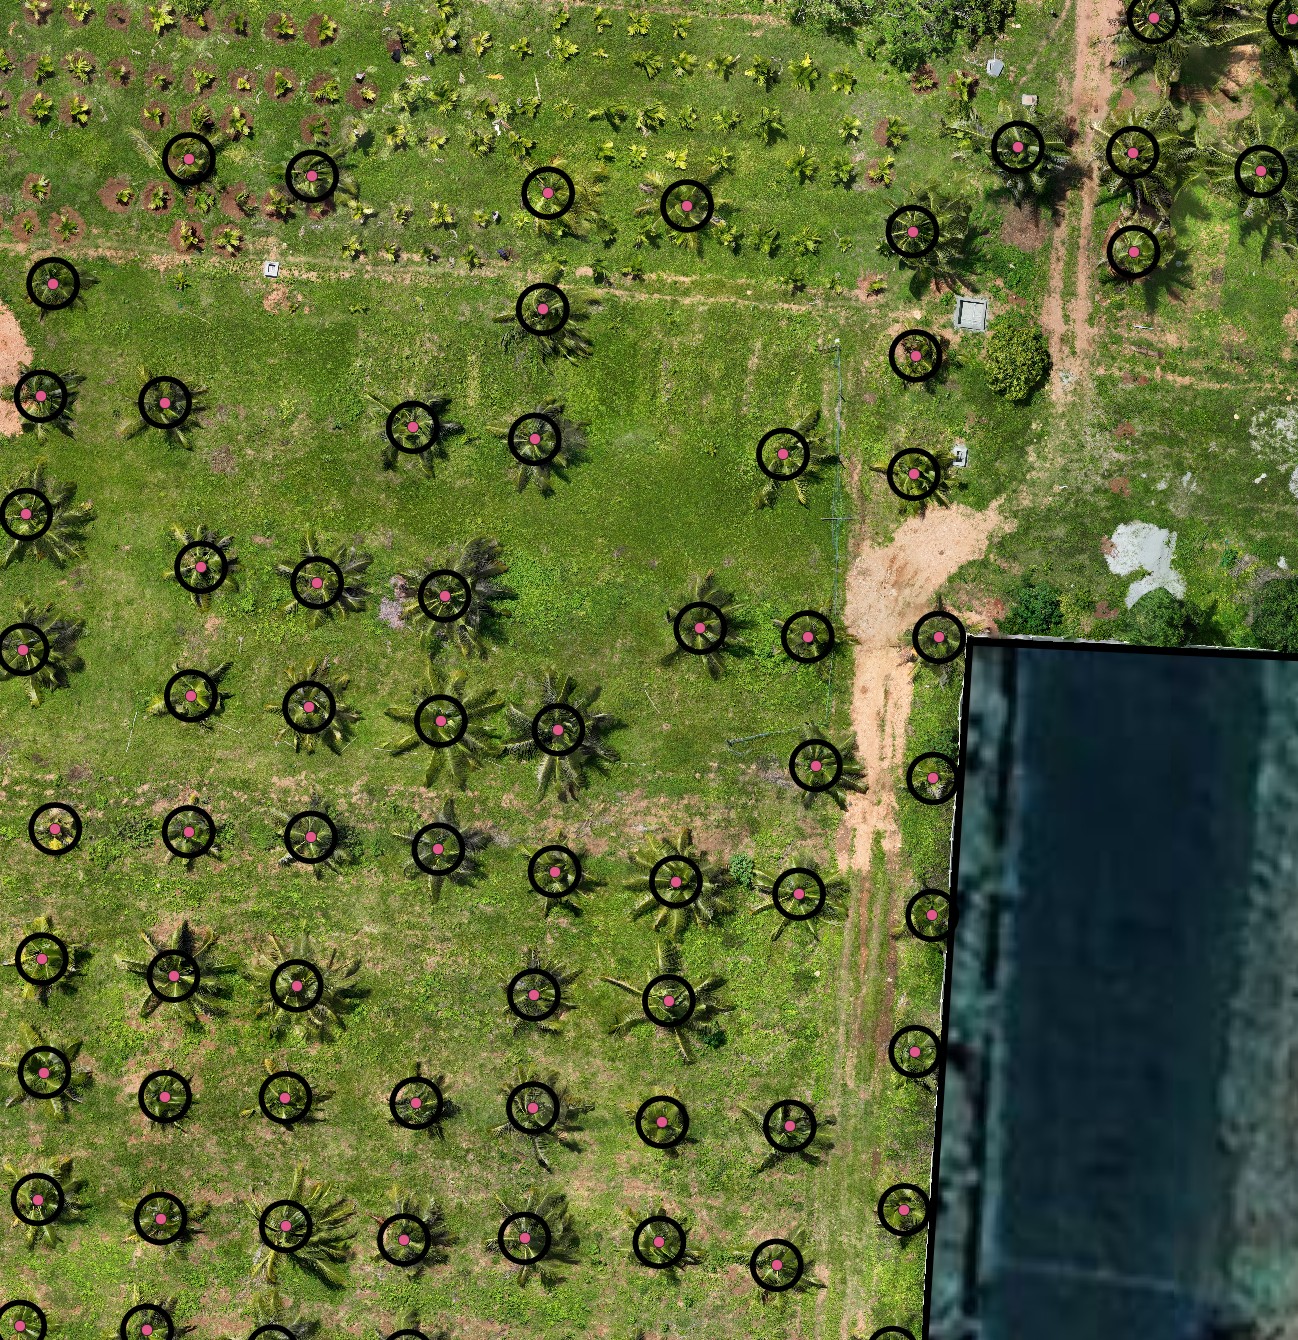
Step 3 — Extract tree height from DSM − DTM
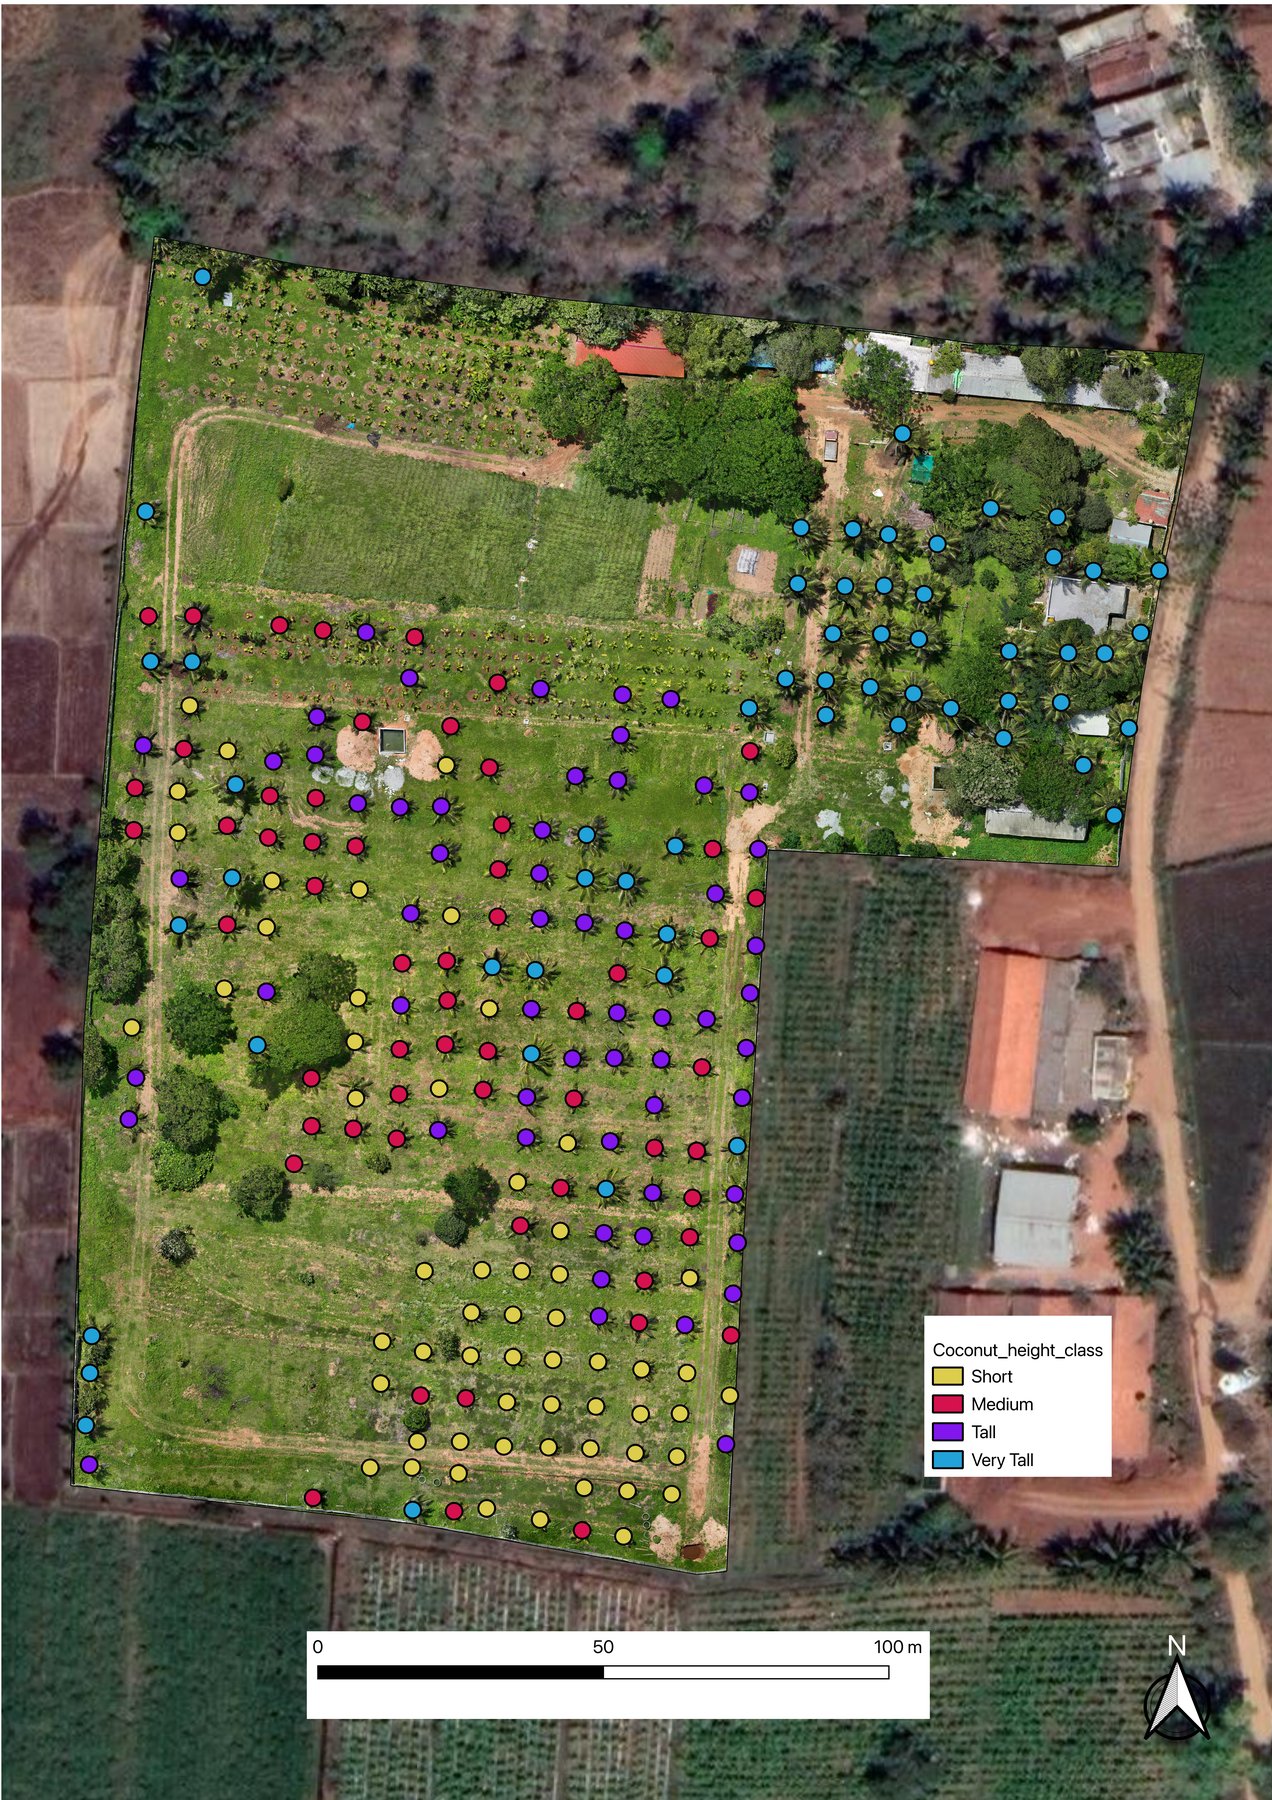
tree_heights_from_dsm_dtm.py samples the DSM and DTM under each crown polygon and writes a height field — the tallest point inside the crown minus the lowest ground point nearby. No point cloud processing required. In practice, that raw height value is usually grouped into percentile classes for visualization (Short/Medium/Tall/Very Tall) — the same classification Step 6 below produces:
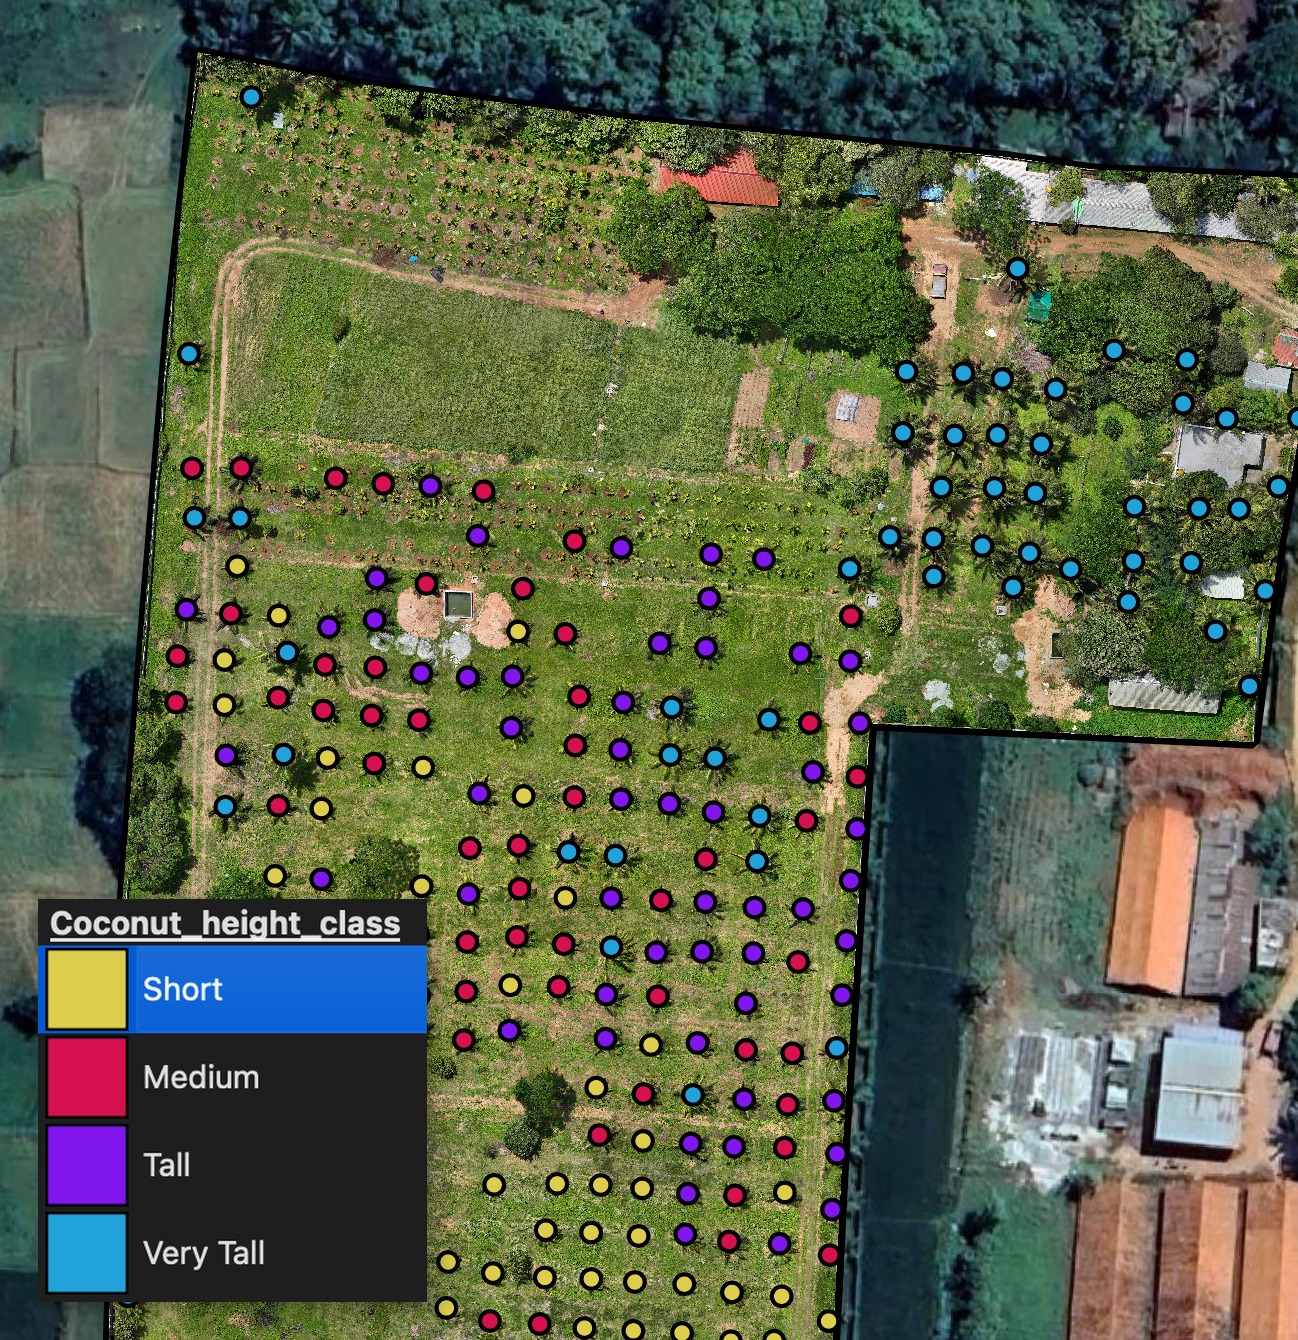
Step 4 — Generate a canopy mask
In parallel, generate_canopy_mask.py builds a binary raster from the same DSM/DTM pair — 1 where there’s canopy, 0 where there’s bare ground. This matters because a tree crown’s bounding circle inevitably includes some open ground between fronds, and that ground would otherwise drag down the NDVI reading.
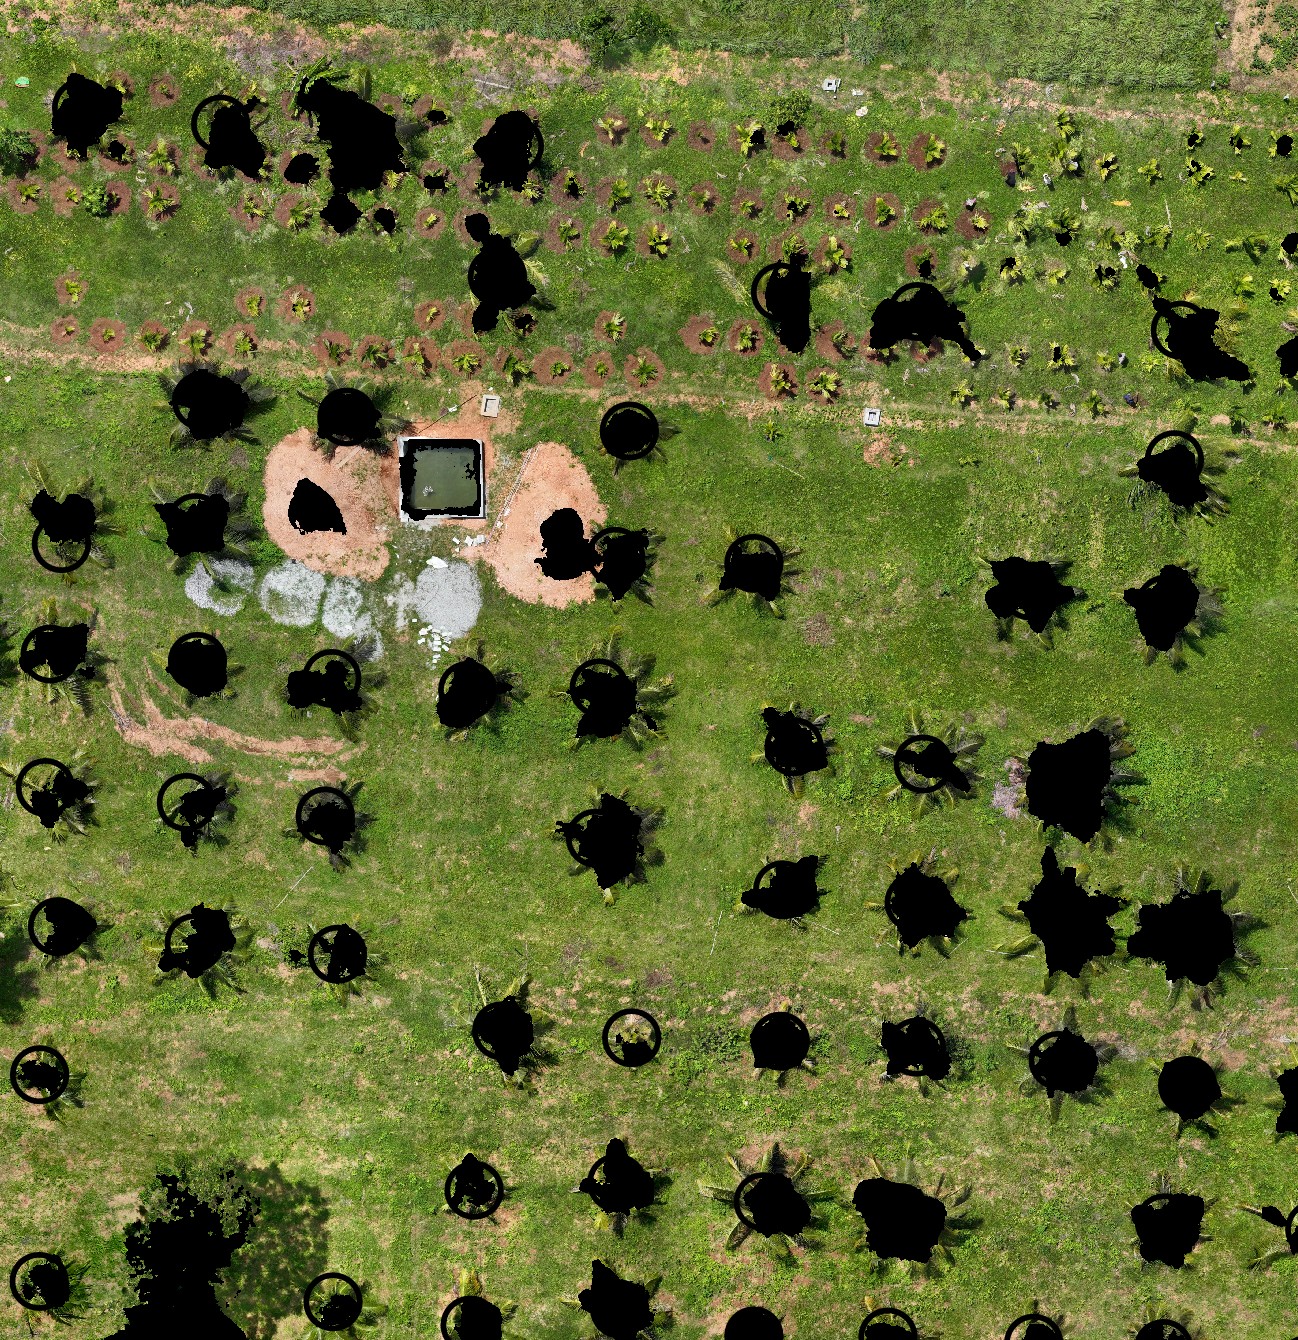
Step 5 — Compute canopy-only NDVI per tree
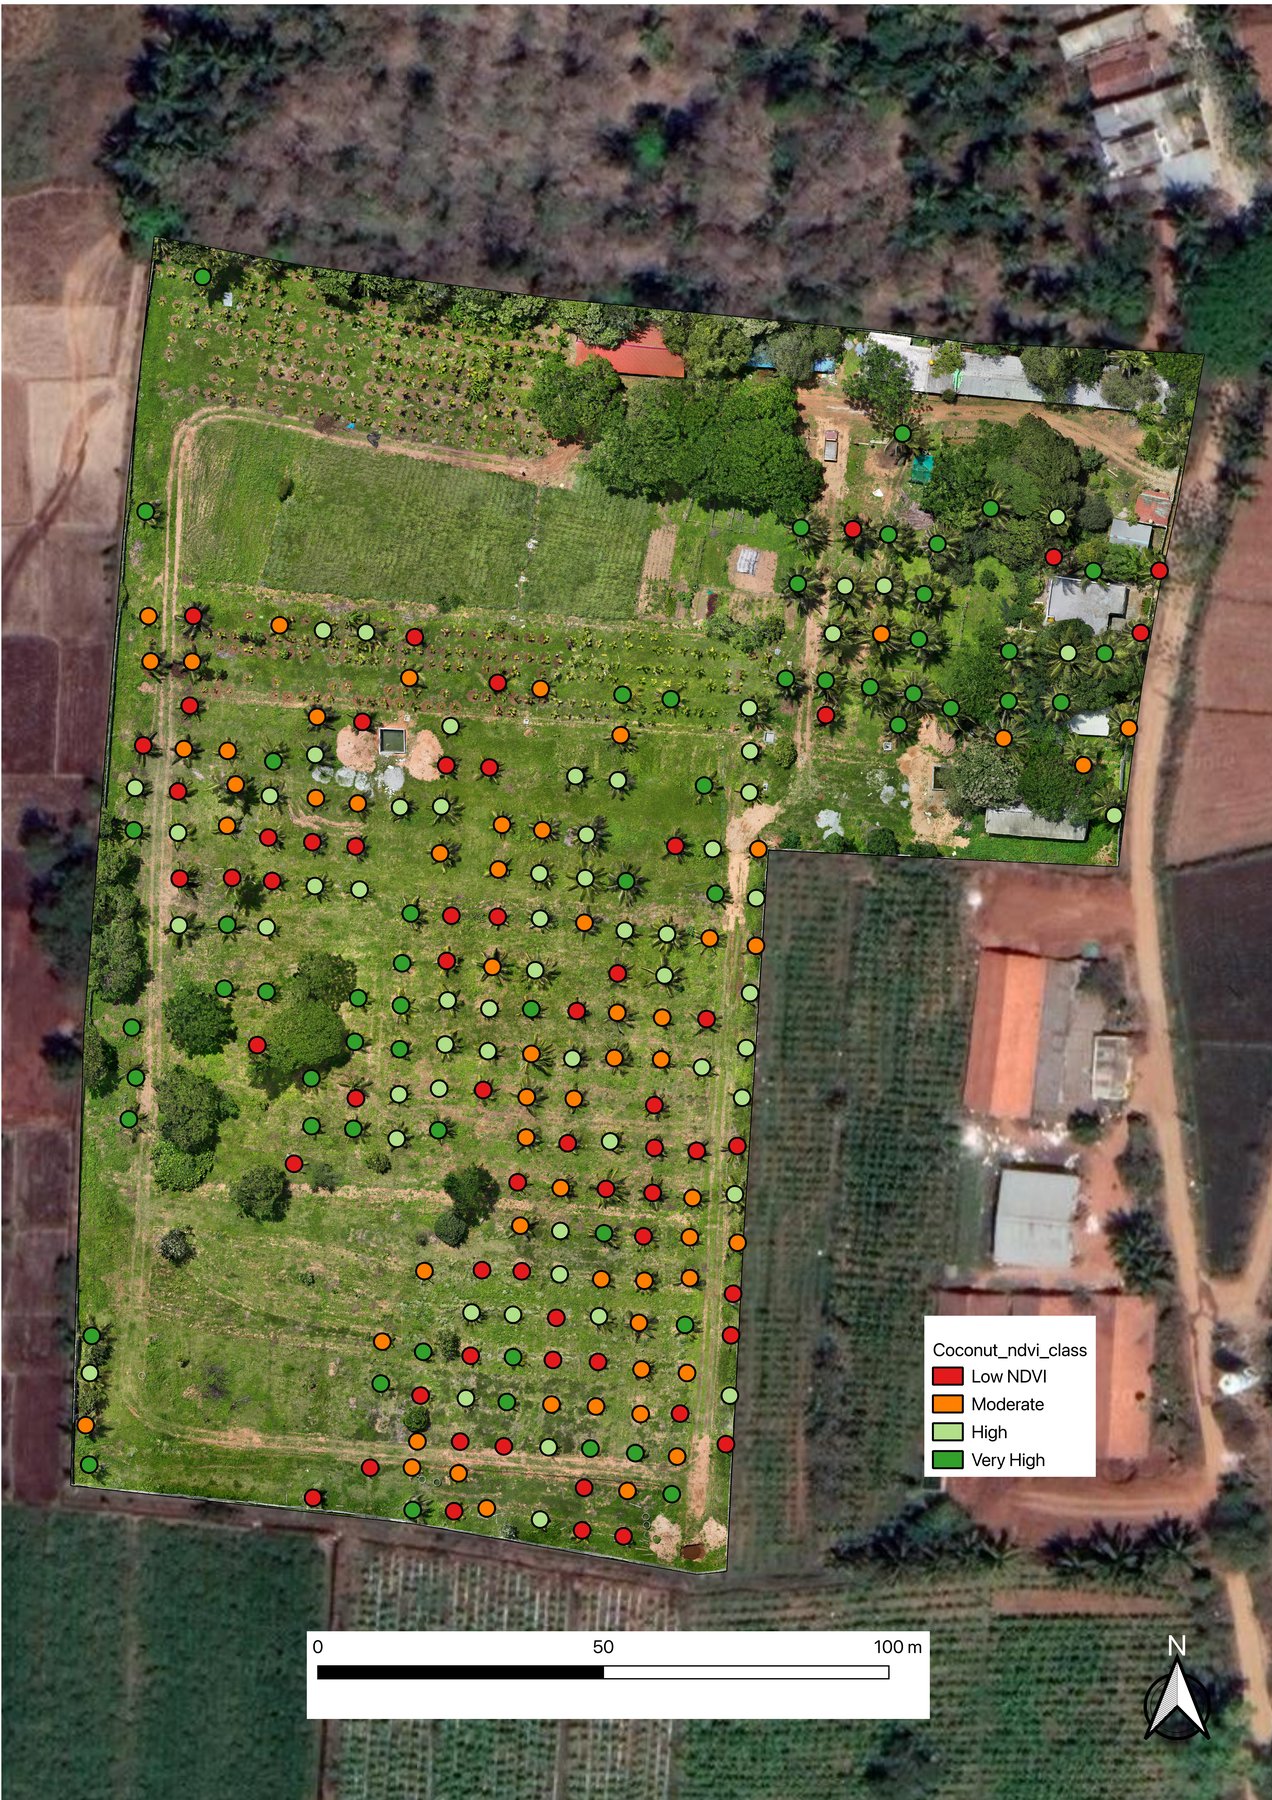
canopy_ndvi_median_calc.py is where the canopy mask pays off. For each crown polygon, it finds every NDVI pixel that’s both inside the polygon and marked as canopy, and writes the median as NDVI_median — ignoring the bare-ground pixels a plain zonal-statistics pass would have included. Same as with height, the raw NDVI_median value is typically grouped into percentile classes for visualization:
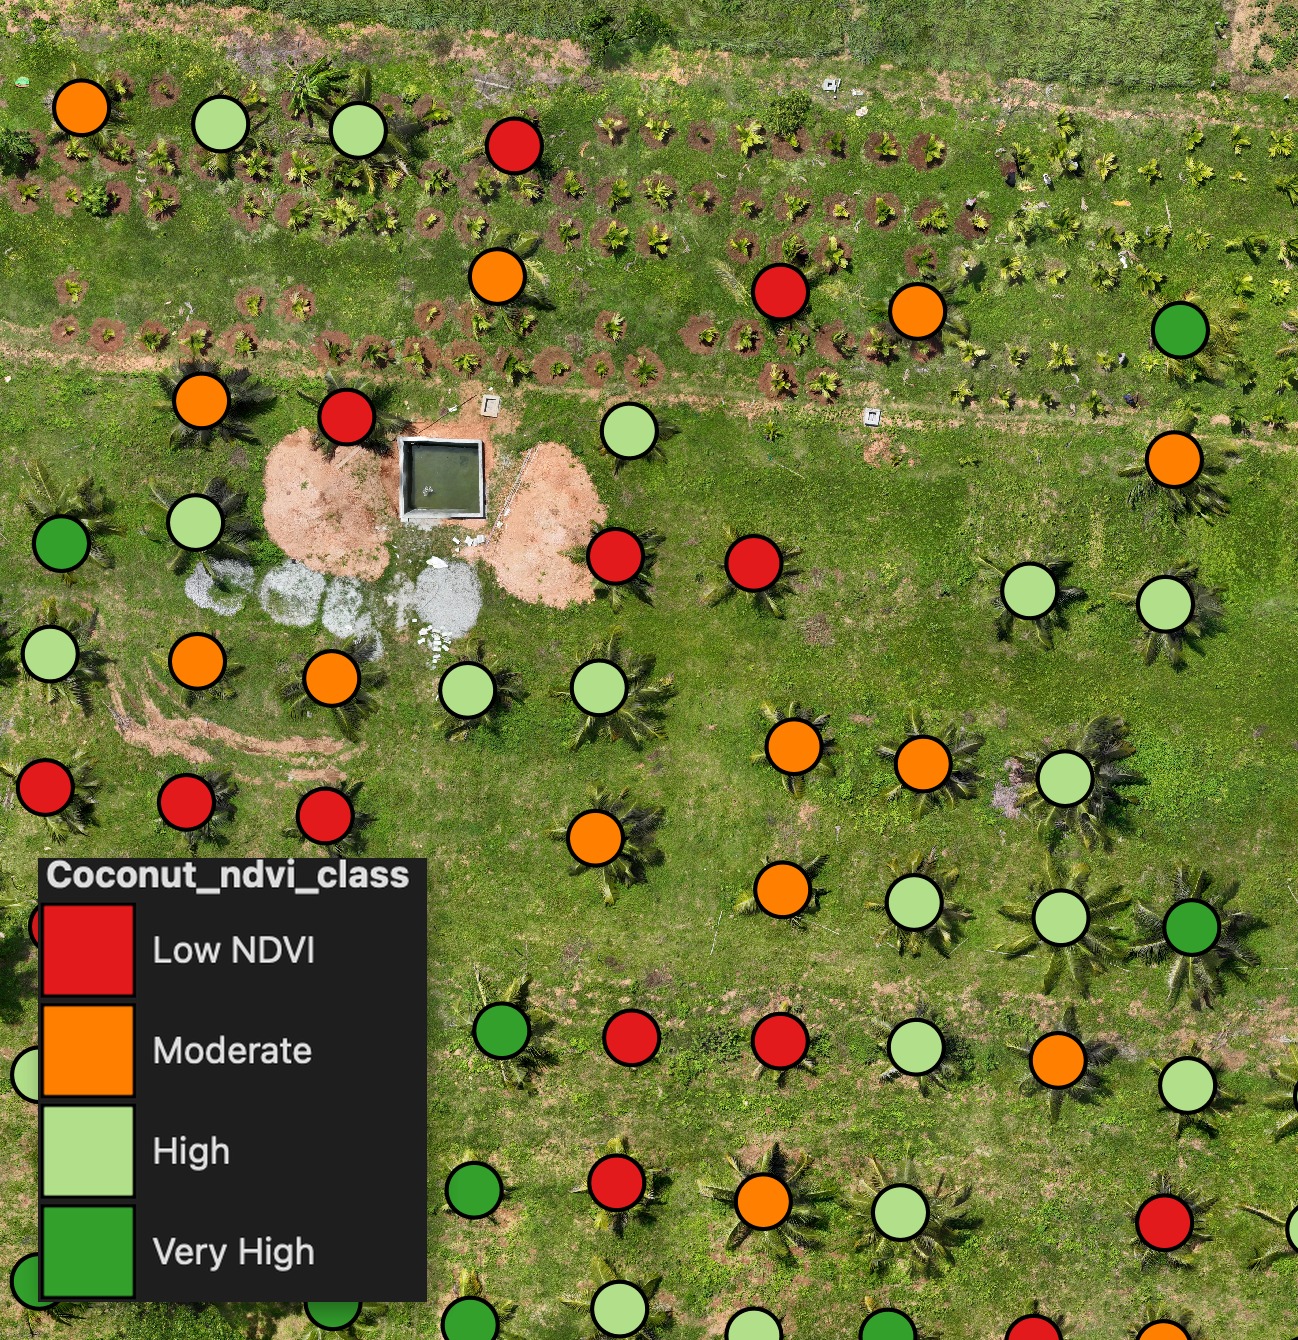
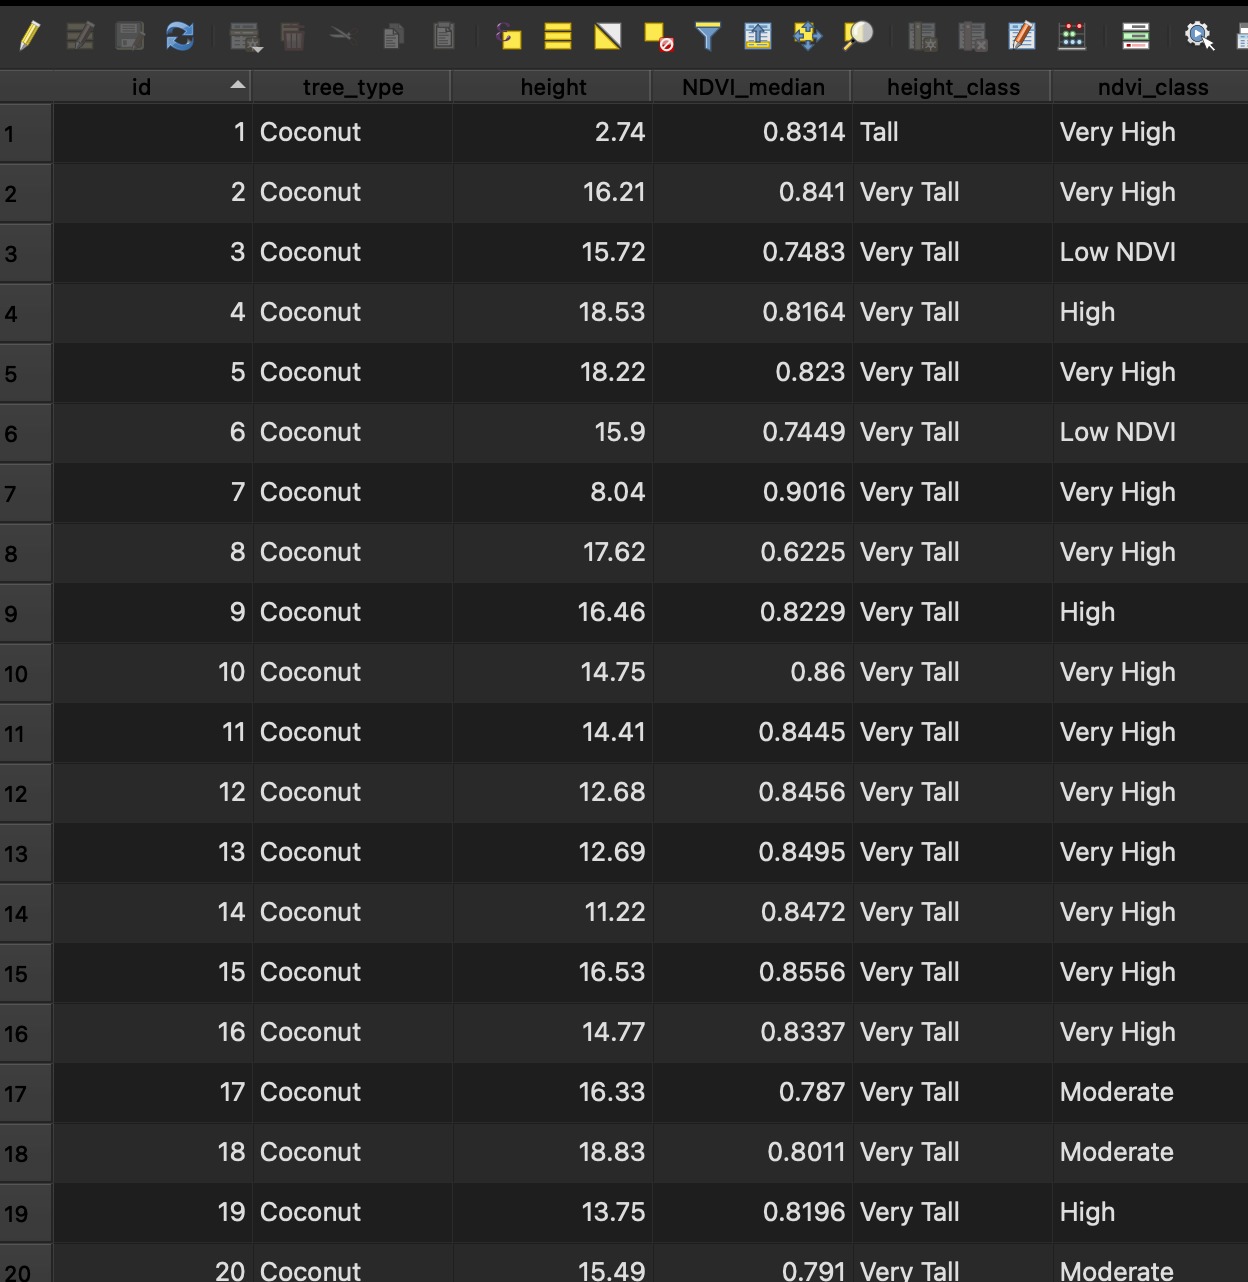
Here’s the attribute table at this point in the pipeline — height and NDVI_median populated per tree, plus height_class and ndvi_class from the classification step next:
Step 6 — Classify by height and NDVI percentile
With height, NDVI_median, and a tree_type label (e.g. “Coconut”) on every feature, distribution_classification.py bins each tree into percentile classes for both metrics — Short/Medium/Tall/Very Tall and Low/Moderate/High/Very High NDVI — and exports a styled layer for each. Steps 3 and 5 above already showed what that classification looks like in QGIS; here’s the same result exported as a print-ready client map, with scale bar, north arrow, and legend:
Step 7 — Plot the distribution
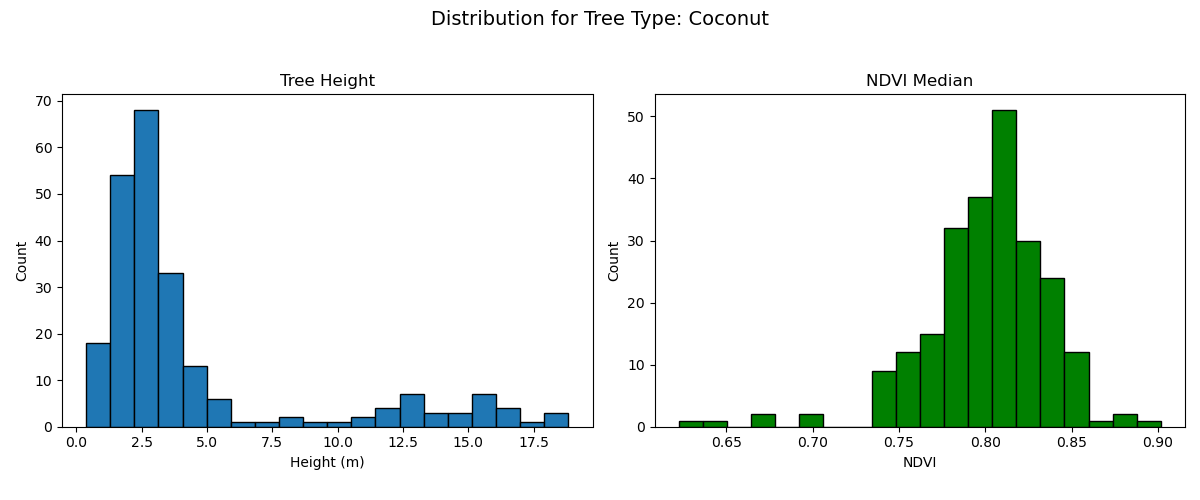
plot_tree_attributes_histograms.py takes the same height + NDVI_median + tree_type fields and plots side-by-side histograms — a quick way to see the overall shape of the plantation’s health and size distribution, not just a per-tree map.
The full chain
Digitize tree points + boundary (manual)
        │
        ▼
buffer_active_layer.py ──────► crown polygons
        │
        ▼
tree_heights_from_dsm_dtm.py ─► + height field
        │
        │   generate_canopy_mask.py ─► canopy_mask.tif
        │           │
        ▼           ▼
canopy_ndvi_median_calc.py ───► + NDVI_median field
        │
        ▼
distribution_classification.py ► height_class + ndvi_class,
        │                         styled per-class layers
        ▼
plot_tree_attributes_histograms.py ► distribution histograms
Two scripts sit outside this exact chain but are commonly used alongside it: generate_chm.py if you want a full canopy height model rather than per-tree point samples, and classify_layer.py for a simpler single-field graduated style when you don’t need distribution_classification.py’s per-tree-type percentile binning.
Why this workflow, not a simpler one
The whole point of routing height and NDVI through canopy-aware, per-crown sampling rather than a single site-wide average is that plantations aren’t uniform — a coconut palm at the edge of a drainage line and one on a slight rise can have meaningfully different vigour, and averaging the whole field hides that. Per-tree classification turns “the plantation looks fine on average” into “these 40 specific trees need attention,” which is the difference between a nice-looking map and something you can actually act on.
Get the scripts
All six scripts in this workflow are part of the Drone Mapping, Terrain & Multispectral Analysis QGIS Package: buffer_active_layer.py, classify_layer.py, tree_heights_from_dsm_dtm.py, generate_canopy_mask.py, canopy_ndvi_median_calc.py, and plot_tree_attributes_histograms.py.