

A Canopy Height Model (CHM) tells you the height of objects above the bare ground at every pixel. It’s one of the most useful outputs of a drone survey — once you have a CHM, you can classify vegetation by height, extract tree heights for individual features, and generate classified maps for client reports.
What it does
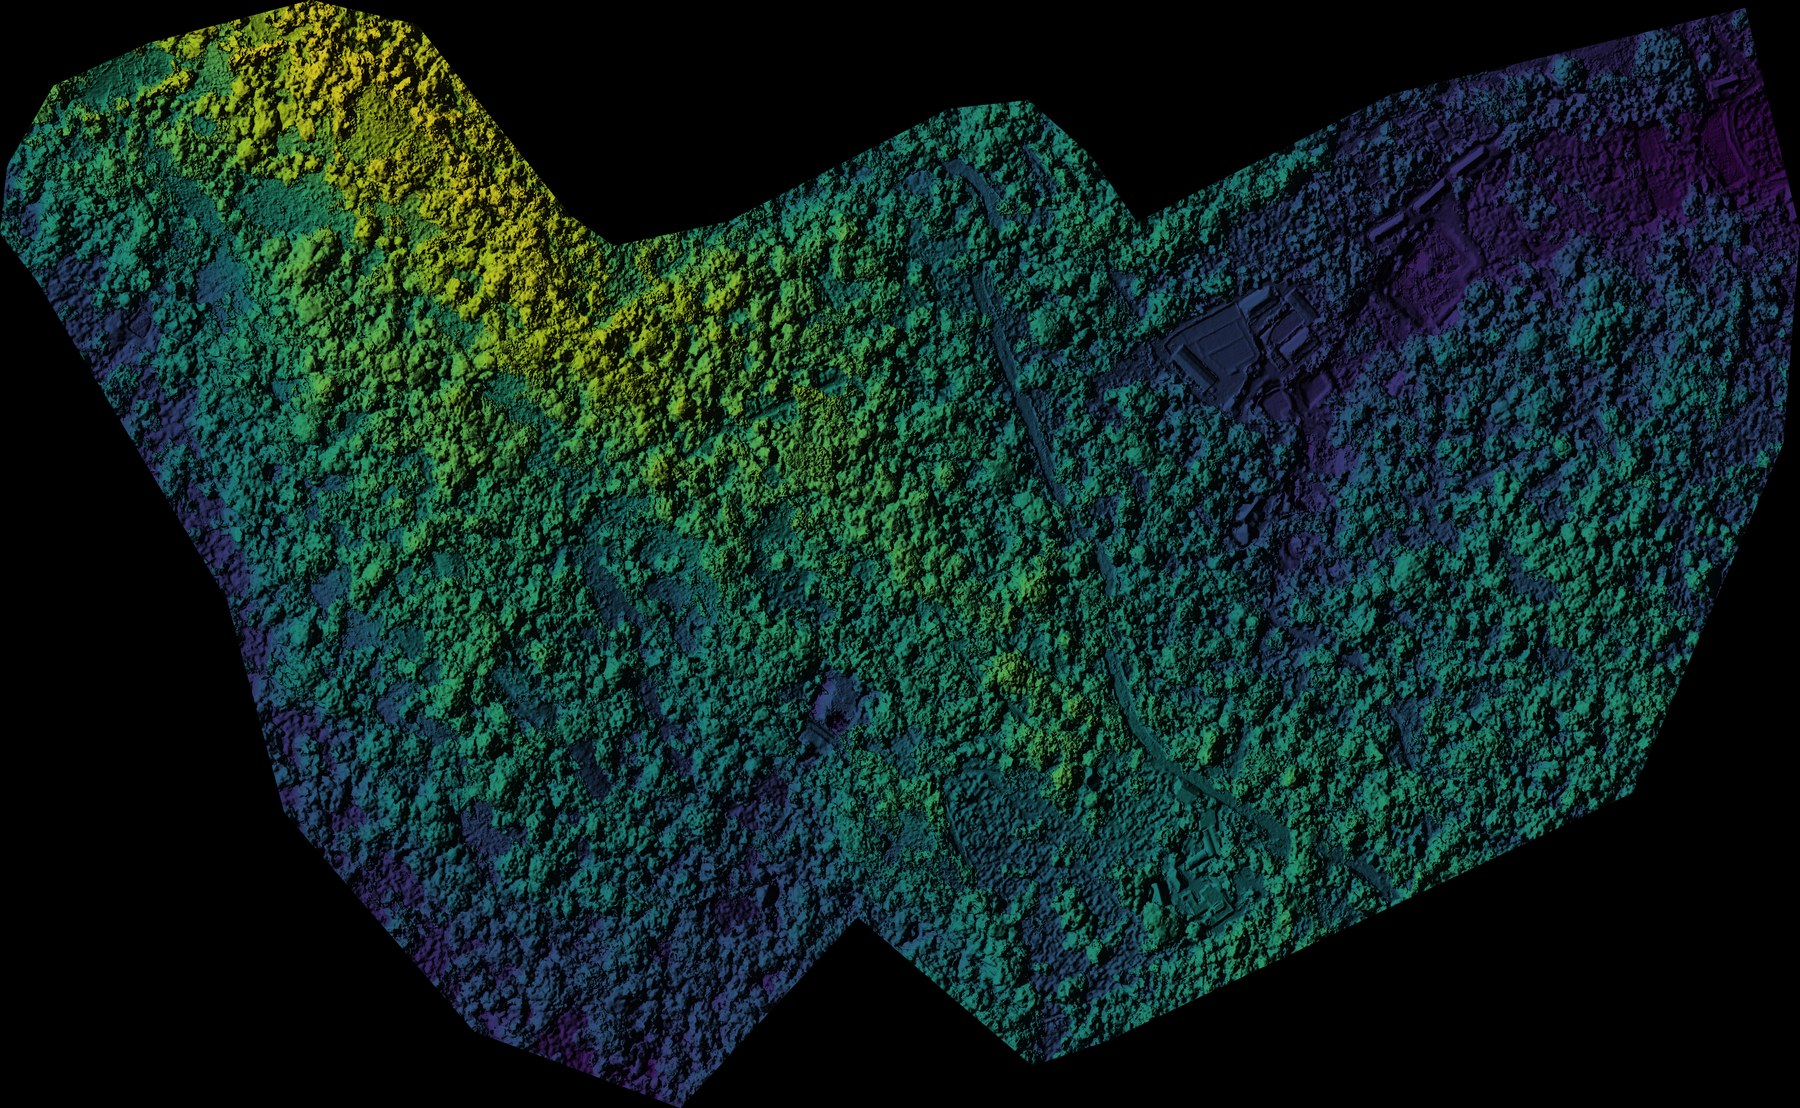
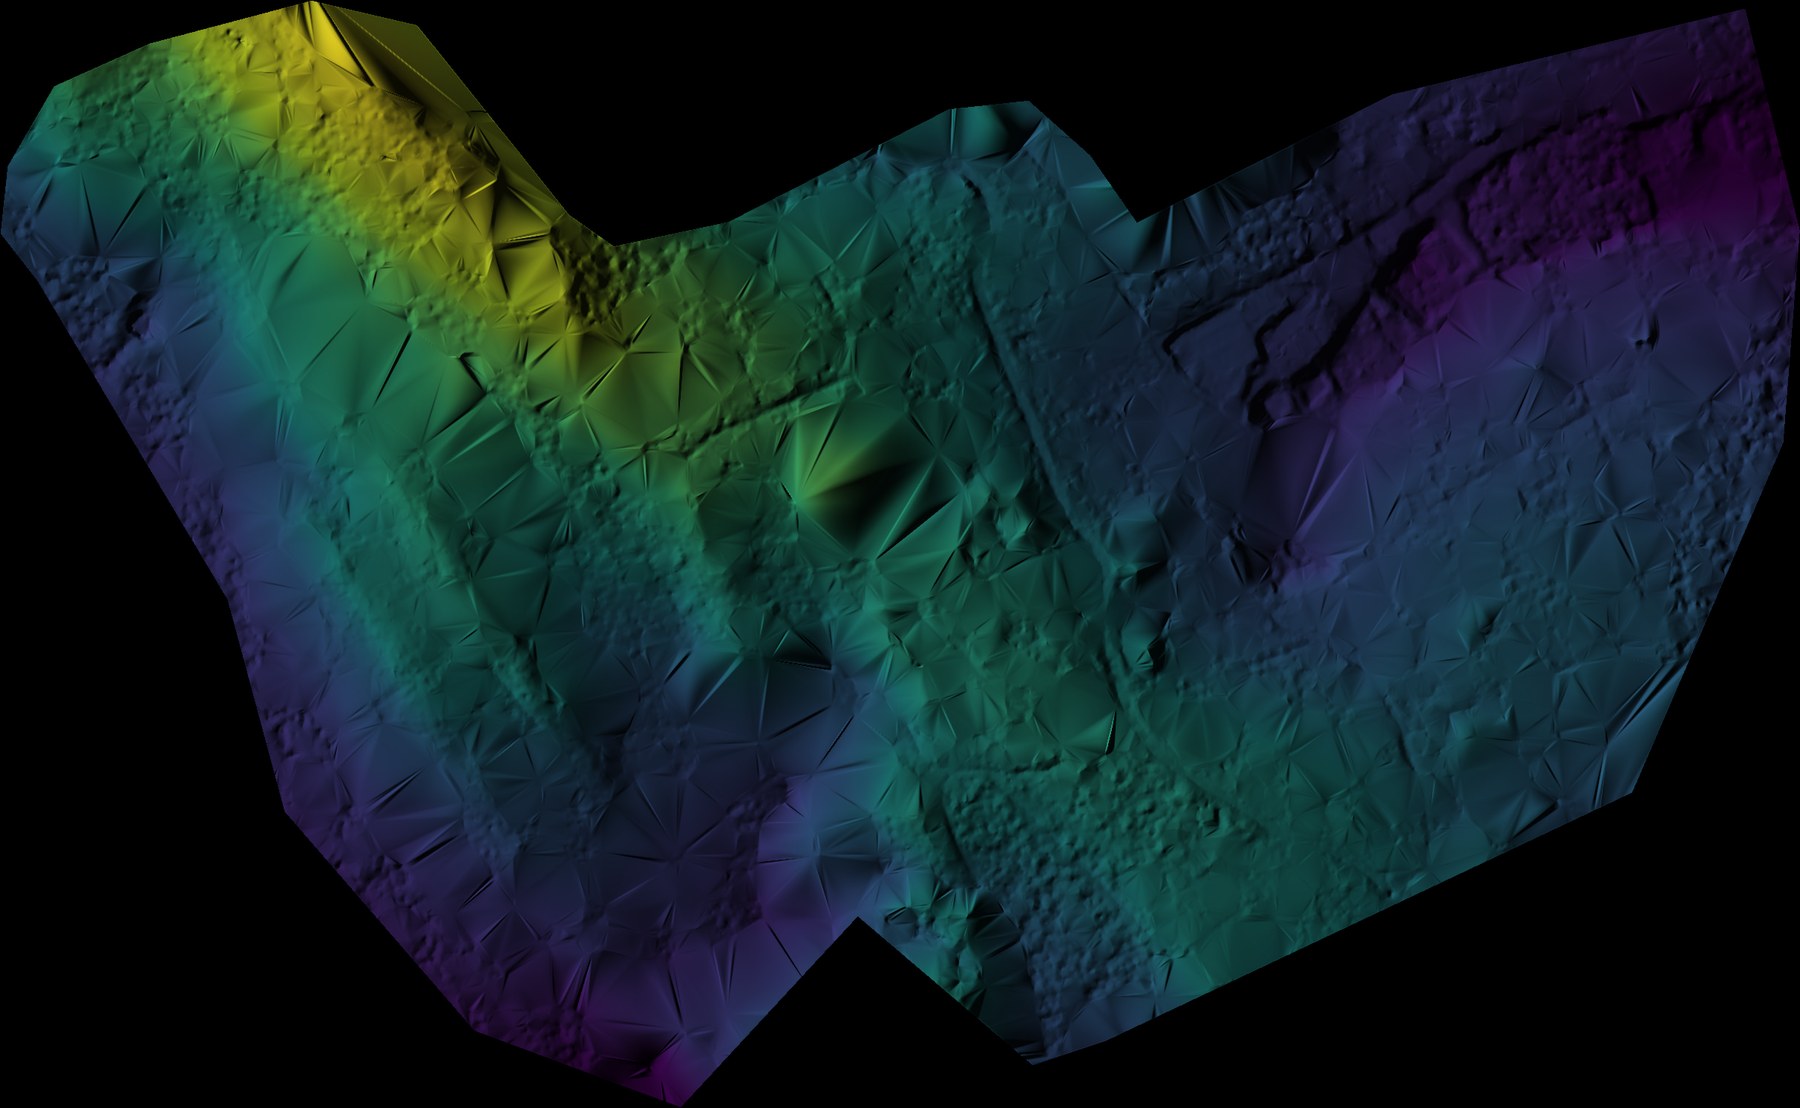
The generate_chm.py script subtracts the DTM (bare earth elevation) from the DSM (surface elevation including trees and structures). The result at each pixel is the height of whatever is there above the ground.
If the DSM and DTM have different spatial resolutions (common when they come from different processing runs), the script automatically resamples the DTM to match the DSM grid before subtraction. Negative values from noise or misalignment are clamped to zero.
Output: {dtm_name}_chm.tif saved in the DTM directory, added to your QGIS project.
What you need
- QGIS 3.28 or newer
numpy,rasterio(bundled with QGIS)- A DSM raster with “dsm” in the layer name, checked in the Layers panel
- A DTM raster with “dtm” in the layer name, checked in the Layers panel
- The
generate_chm.pyscript from the Drone Mapping, Terrain & Multispectral Analysis QGIS Package
The two rasters this script reads, as coloured hillshade — DSM (surface, includes canopy):
DTM (bare ground only):
Steps
- Load your DSM and DTM rasters into QGIS. The layer names must contain
dsmanddtmrespectively. - Check (tick) both layers in the Layers panel.
- Open Plugins → Python Console → Show Editor.
- Paste the script and click Run.
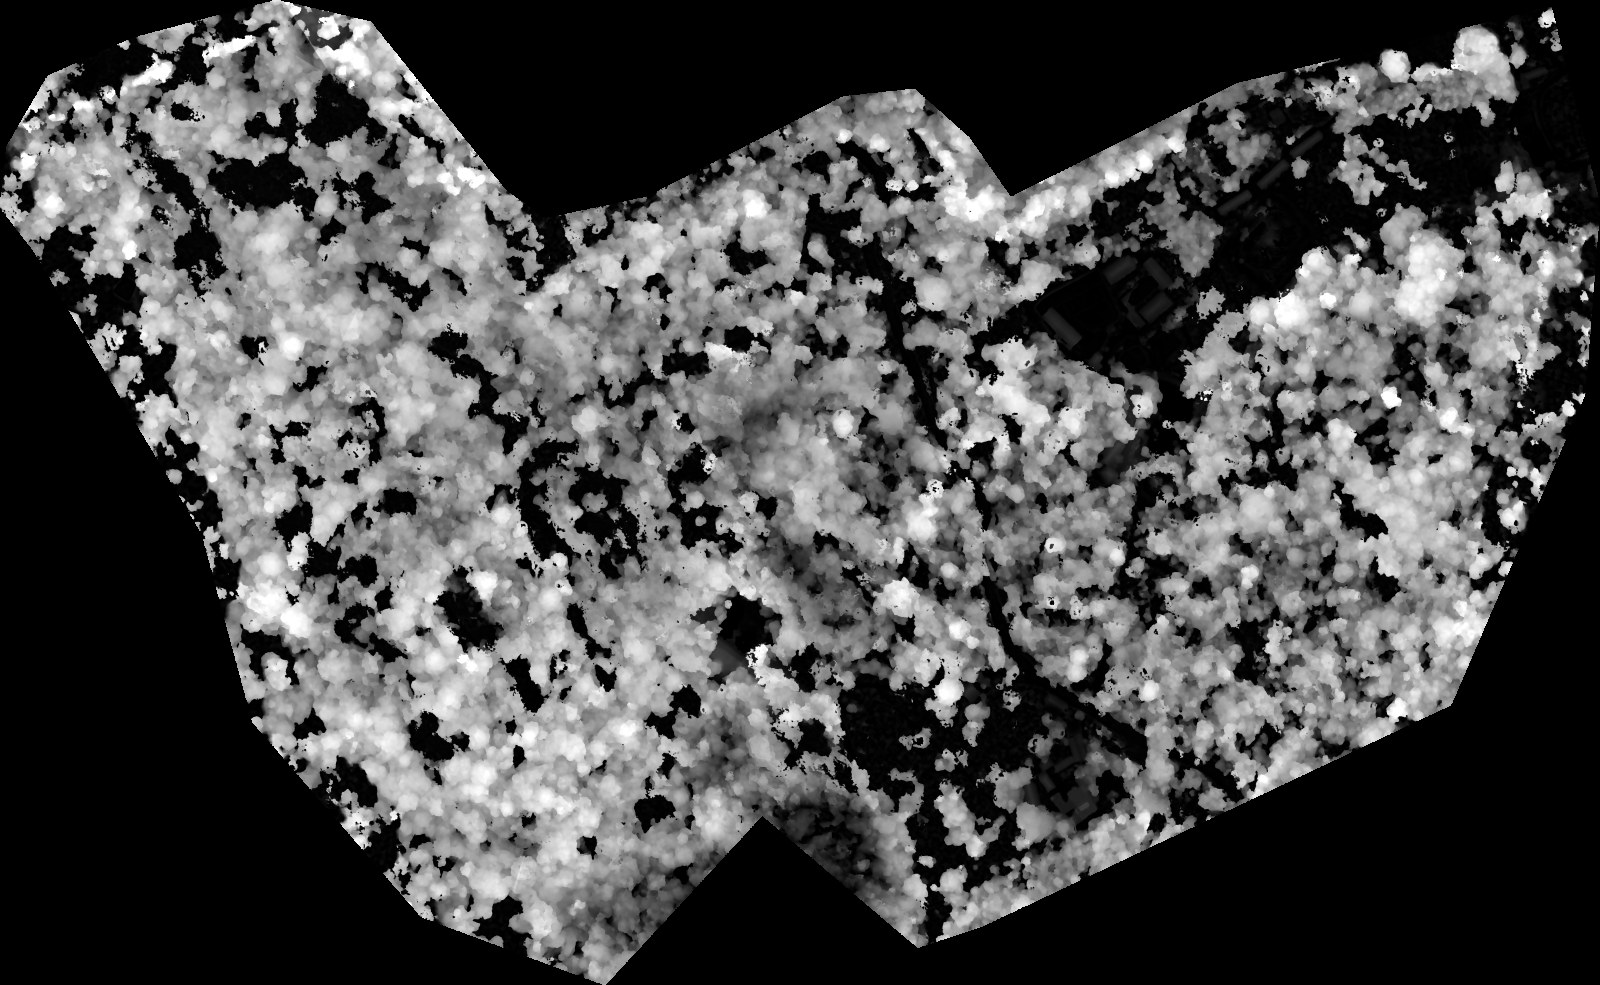
The CHM is saved in the DTM directory and loaded into your QGIS project. Raw, it looks like this — a grey/white gradient, bright where the canopy is tall:
What to do with the CHM
Once you have a CHM, you can:
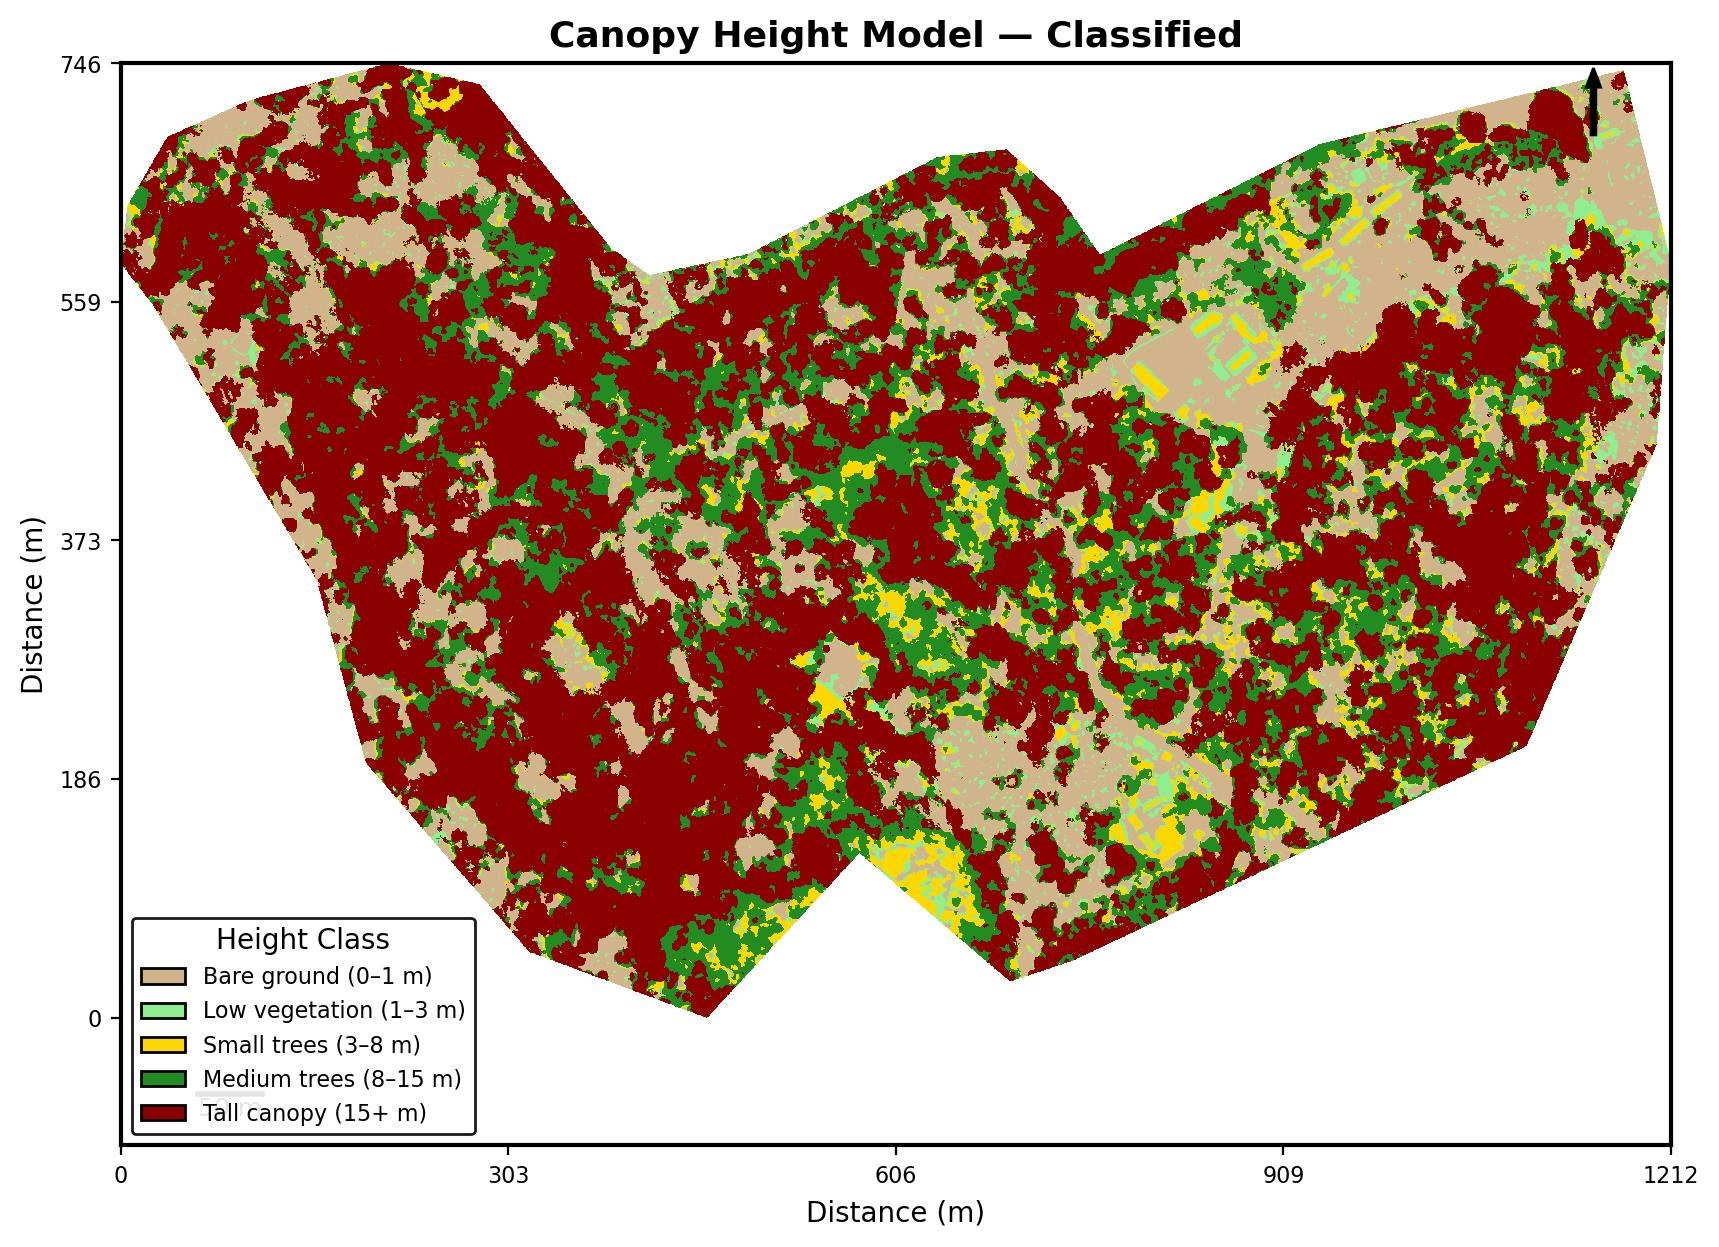
- Style it — use style_chm.py to apply classified height bands and export a map JPEG
- Extract tree heights — use tree_heights_from_dsm_dtm.py to add a height field to individual tree polygons
- Generate a canopy mask — use generate_canopy_mask.py to separate canopy from ground
Here’s the same CHM after style_chm.py classifies it into height bands — much easier to read than the raw grey version above:
Typical CHM values in plantation surveys
In a mature plantation:
- 0–1 m: ground cover, low shrubs
- 1–5 m: young trees or understorey
- 5–15 m: mid-canopy trees
- 15 m+: tall canopy in well-established estates
Get the script
generate_chm.py is part of the Drone Mapping, Terrain & Multispectral Analysis QGIS Package — all 16 QGIS automation scripts at $99 USD.