

Manually applying a graduated colour style in QGIS means opening Layer Properties, picking a field, choosing a colour ramp, and hitting Classify. If you do this on multiple layers or regularly, it adds up. This script does it in one run.
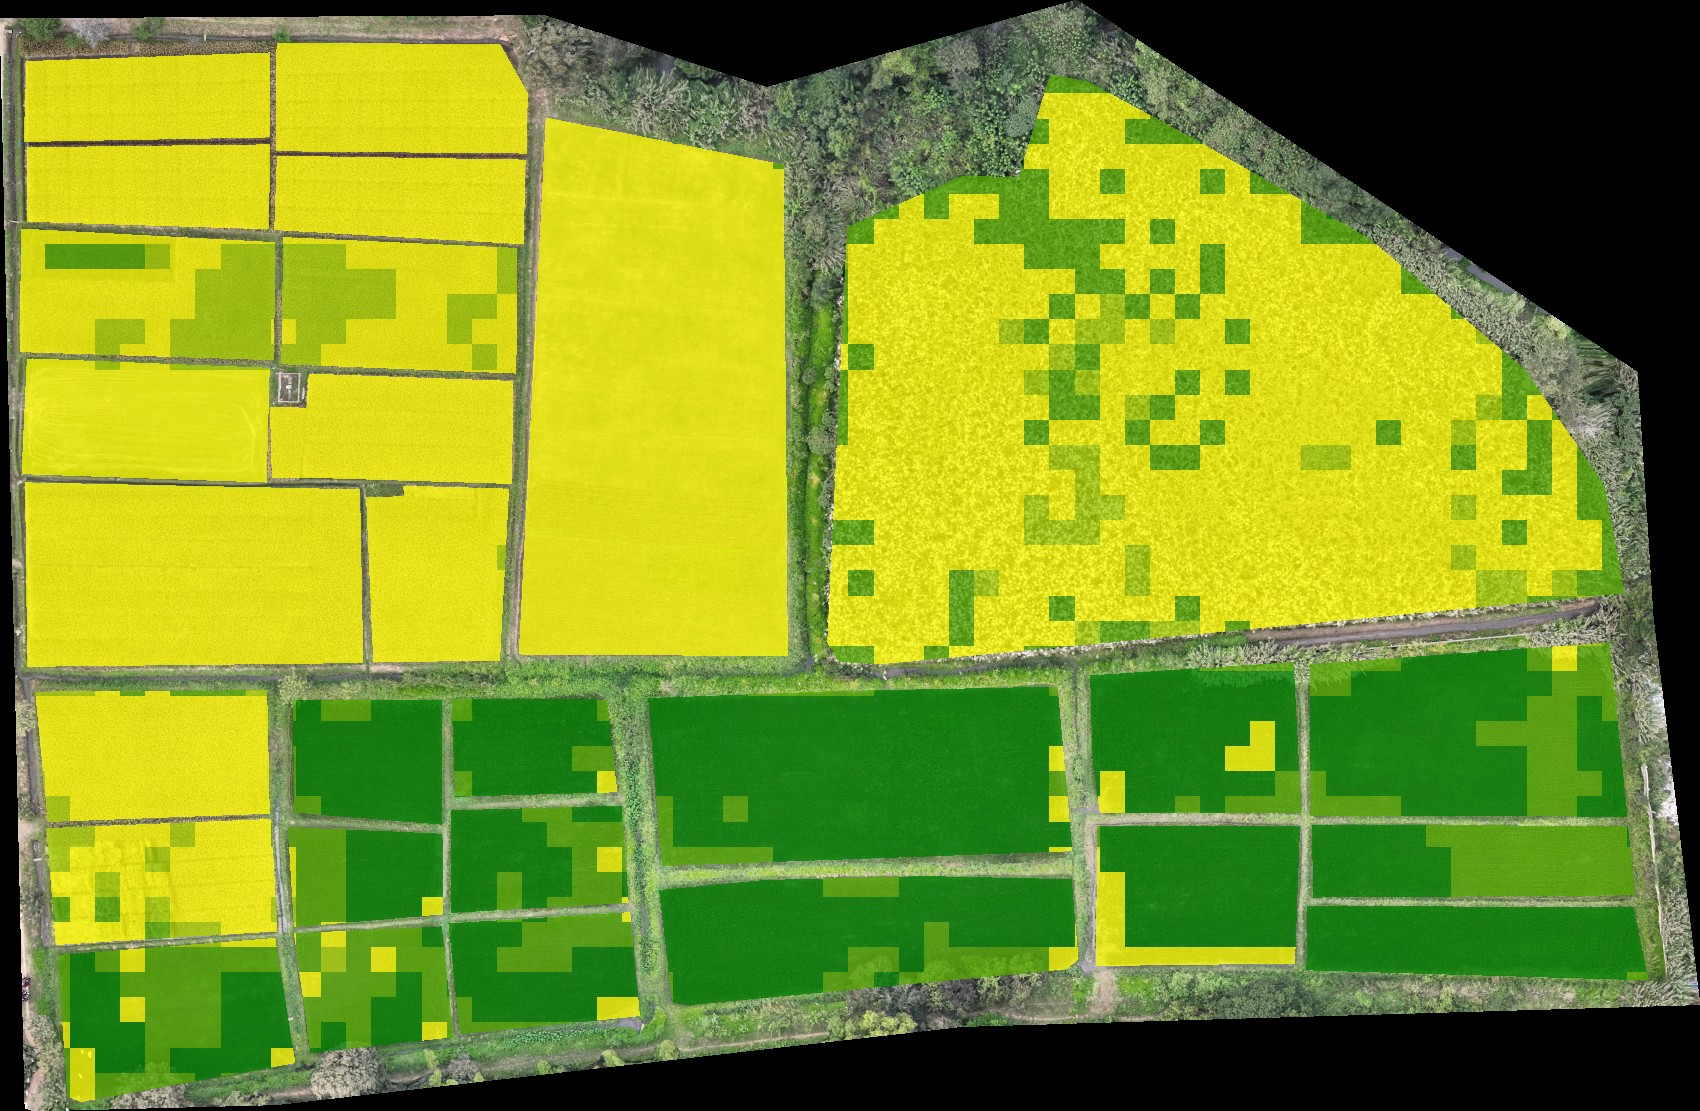
Here’s the real result on a sampling grid’s ndvi_mean field — percentile method, quartile breaks at 0.56, 0.69, and 0.83 from an actual value range of 0.043–0.891:
What it does
The classify_layer.py script applies a graduated yellow → green colour classification to any numeric attribute column on the first checked vector layer. Two classification methods are supported:
discrete— divides the value range into equal-width steps of 0.1 (e.g. 0–0.1, 0.1–0.2, etc.)percentile— divides by data distribution into four quartiles (0–25%, 25–50%, 50–75%, 75–100%)
The style is applied in-place to the layer renderer — no output file is created.
What you need
- QGIS 3.28 or newer
- A vector layer with a numeric attribute column, checked (ticked) in the Layers panel
- The
classify_layer.pyscript from the Drone Mapping, Terrain & Multispectral Analysis QGIS Package
Steps
- Load your vector layer into QGIS and check (tick) it in the Layers panel.
- Open Plugins → Python Console → Show Editor.
- Paste the script. At the bottom, find the function call and set:
column— the name of the numeric field to classify (default:'ndvi_mean')method—'discrete'or'percentile'(default:'discrete')
- Click Run. The layer updates immediately in the canvas.
When to use each method
| Method | Best for |
|---|---|
discrete | When the data range is known and consistent (e.g. NDVI 0–1) |
percentile | When you want to show relative ranking regardless of actual values |
Percentile is particularly useful for height or custom scores where the range varies per dataset — it always fills the full colour spectrum even if actual values are clustered.
Changing the discrete step size
discrete mode always uses a step of 0.1 — but that’s not exposed as a function parameter the way column and method are, it’s hardcoded a few lines into the script:
if method == 'discrete':
    step = 0.1
Open the script and change 0.1 to whatever step suits your data — 0.05 for finer NDVI bands, 1 or 5 for a height field in metres, and so on. There’s no need to touch anything else; the rest of the function (breaks, labels, colour ramp) adapts automatically to whatever step you set.
Related scripts
Once your layer is styled, create_map_layout.py turns the current canvas view — including this classification — into a print-ready A4 layout with a legend.
Get the script
classify_layer.py is part of the Drone Mapping, Terrain & Multispectral Analysis QGIS Package — all 16 QGIS automation scripts at $99 USD.