

Standard zonal statistics for NDVI averages every pixel inside a polygon — including bare soil, paths, and shadows. In a plantation or orchard where open ground is common within plot boundaries, this gives a misleading health reading. This script uses a canopy mask to fix that.
What it does
The canopy_ndvi_median_calc.py script samples NDVI values from the NDVI raster within each polygon in the active layer, but only where the canopy mask pixel is greater than zero (indicating actual vegetation). The median of those canopy-only NDVI values is written as a new NDVI_median field on each polygon feature.
What you need
- QGIS 3.28 or newer
numpy,rasterio(bundled with QGIS)- A polygon layer (plots or zones) set as the active layer
- A raster layer named exactly
canopy_maskchecked in the Layers panel - An NDVI raster with “ndvi” in the layer name, checked in the Layers panel
- The
canopy_ndvi_median_calc.pyscript from the Drone Mapping, Terrain & Multispectral Analysis QGIS Package
Steps
- Run
generate_canopy_mask.pyfirst to create thecanopy_masklayer (see the tutorial on generating a canopy mask). - Load your polygon plot layer and click it to make it the active layer.
- Check (tick) the
canopy_maskand NDVI rasters in the Layers panel. - Open Plugins → Python Console → Show Editor.
- Paste the script and click Run.
The output file {input_name}_with_ndvi.geojson is saved alongside the original and added to your QGIS project, with a new NDVI_median field on each polygon.
Here’s the result on a real coconut plantation survey, NDVI_median grouped into percentile classes and styled — the same real project this script’s full workflow write-up walks through end to end:
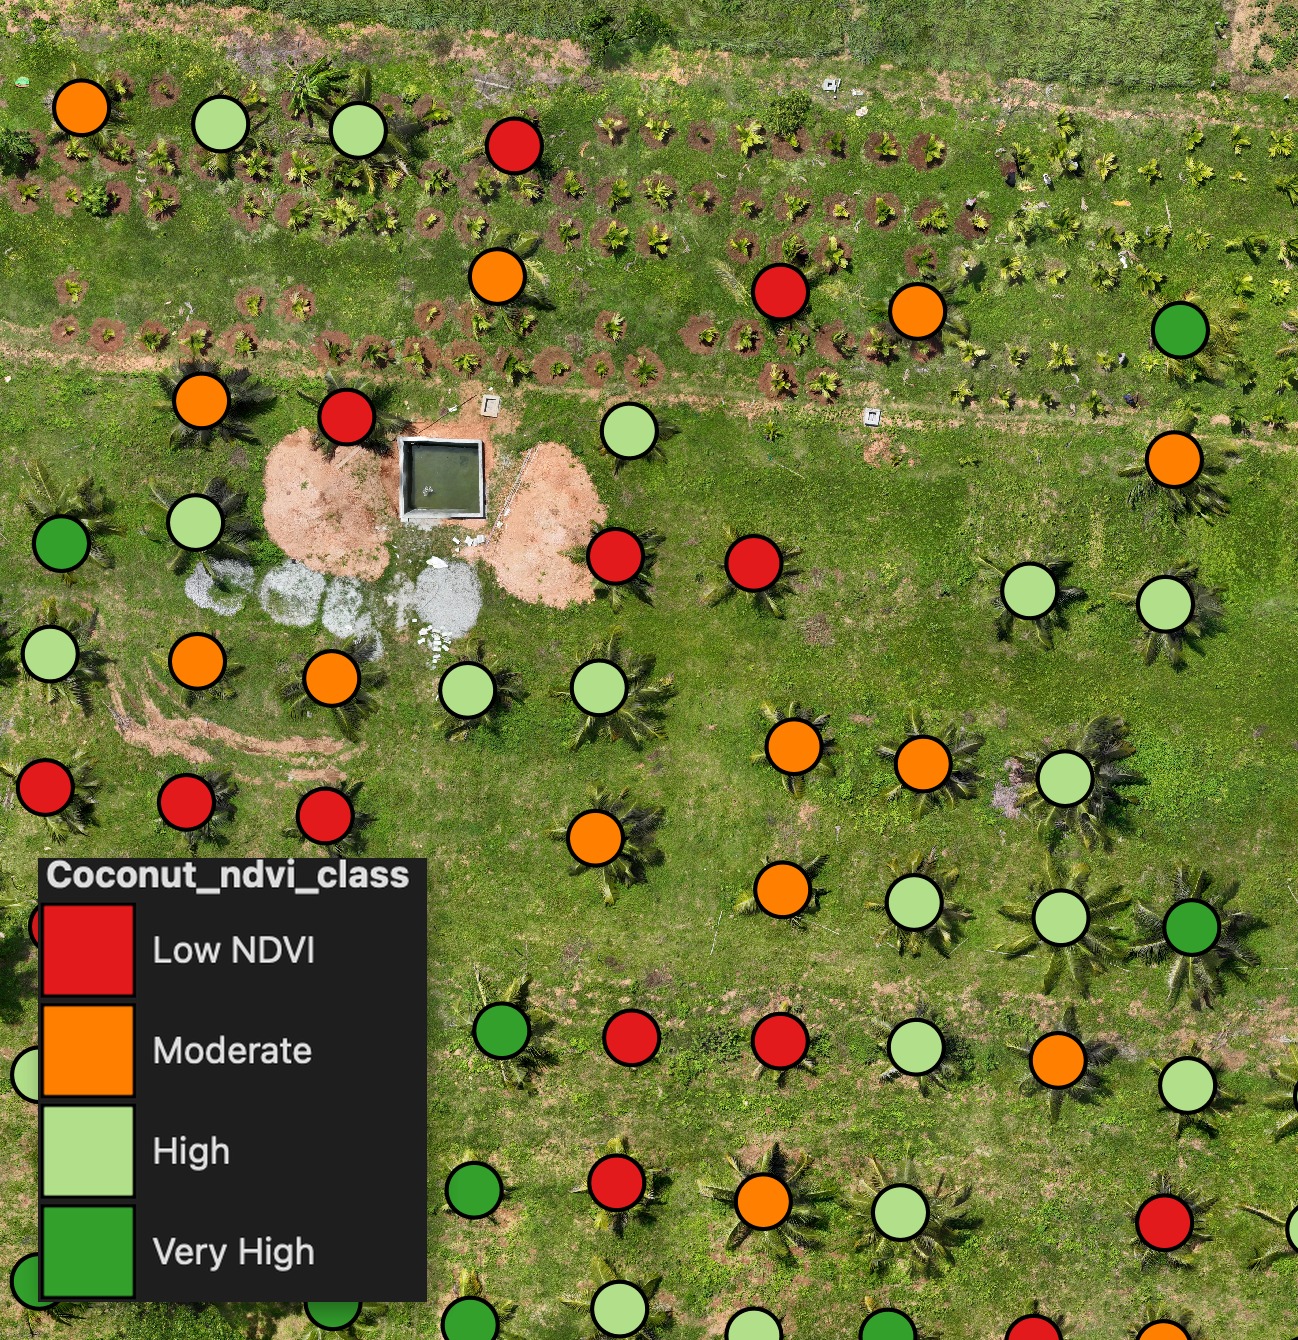
To visualise the result, run classify_layer.py on the output with NDVI_median as the target field — it applies a graduated colour ramp so you can see healthy vs. stressed plots or trees at a glance. If your polygons also have a height field (from tree_heights_from_dsm_dtm.py) and a tree_type label, distribution_classification.py can classify by both height and NDVI percentile together, per crop type, in one pass.
Before you start
This script needs three things already in place — one required, two only if you’re working with individual tree crowns rather than a boundary or grid:
canopy_maskraster — required. Run generate_canopy_mask.py first.- The polygon layer itself. For a single site boundary or a sampling grid, you likely already have it. For per-tree analysis, digitize or detect tree points, then run buffer_active_layer.py to turn each point into a crown-sized polygon before running this script.
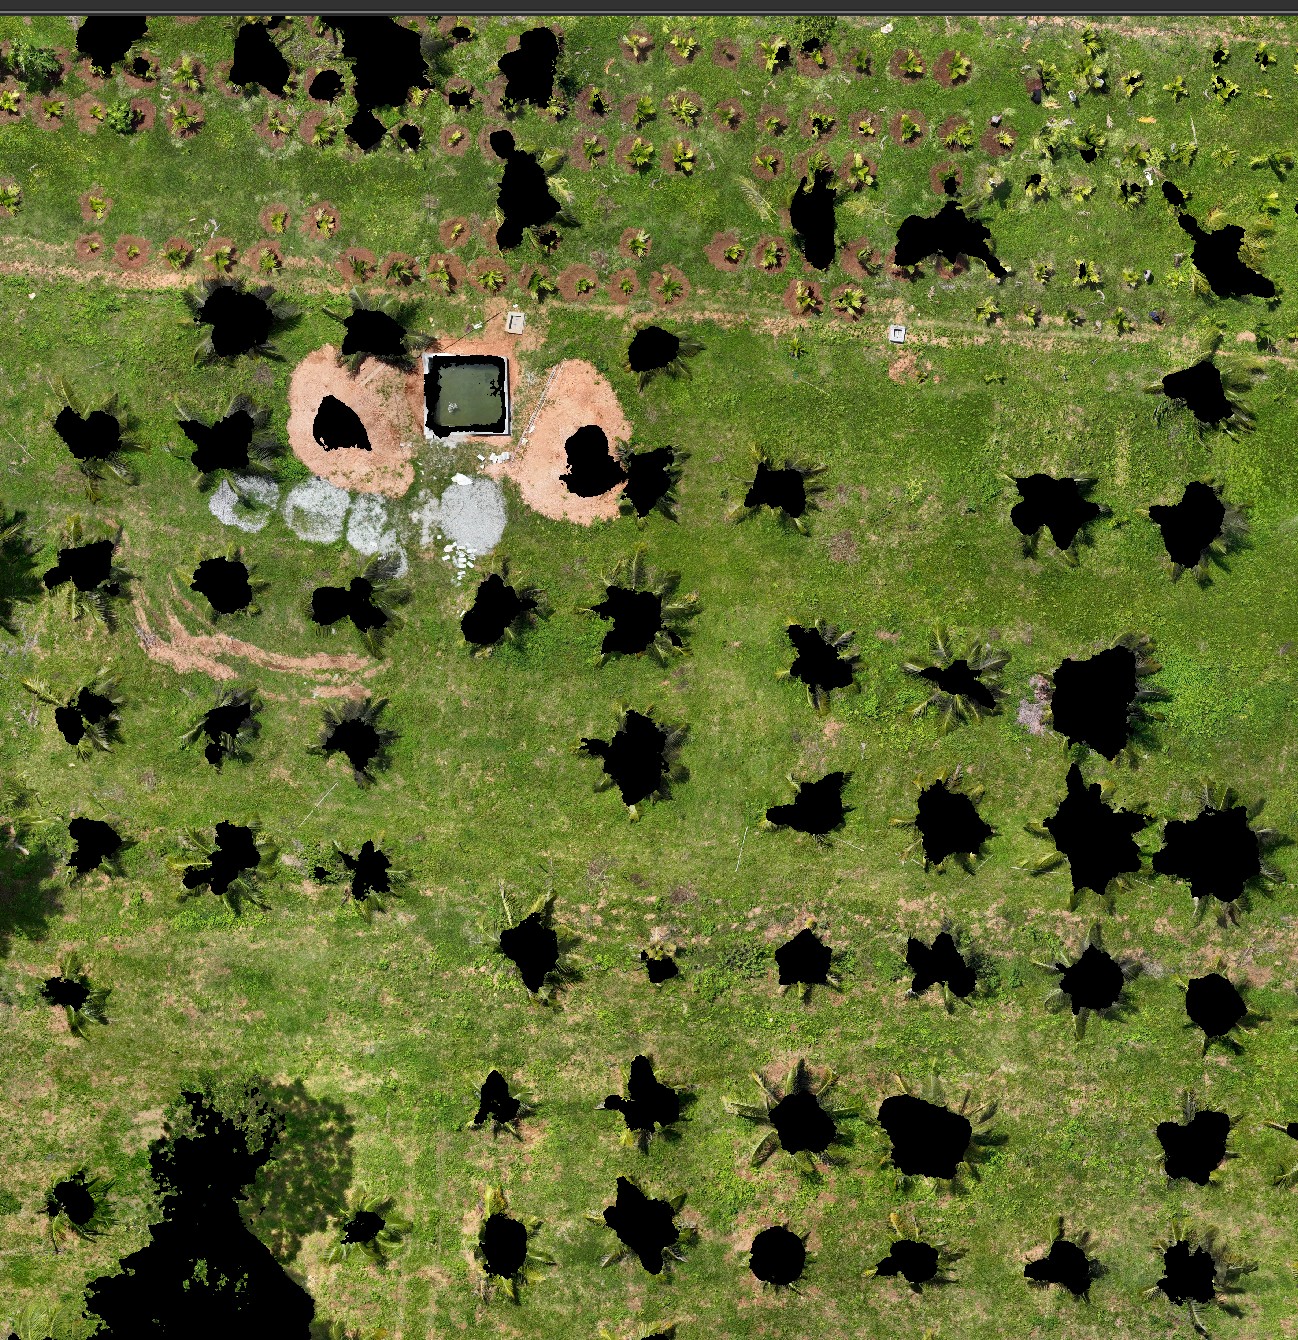
The canopy mask on its own — solid black where canopy was detected, no crown polygons yet:
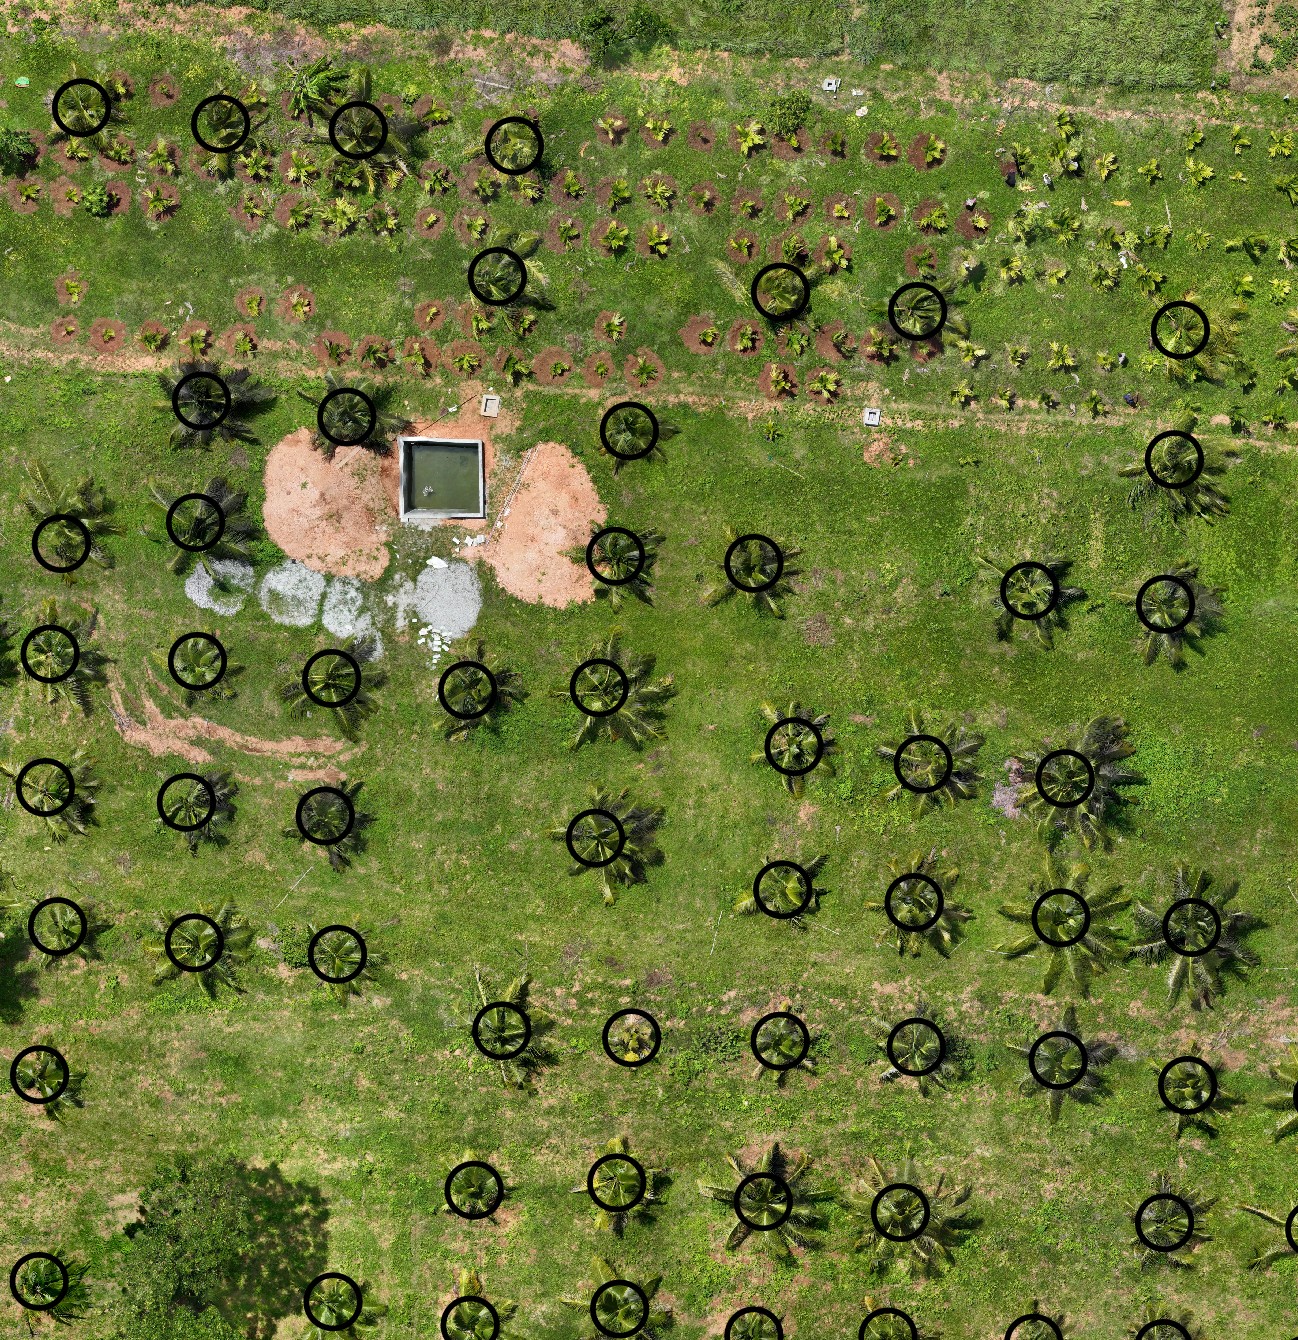
The buffered crown polygons on their own — the active layer this script samples into:
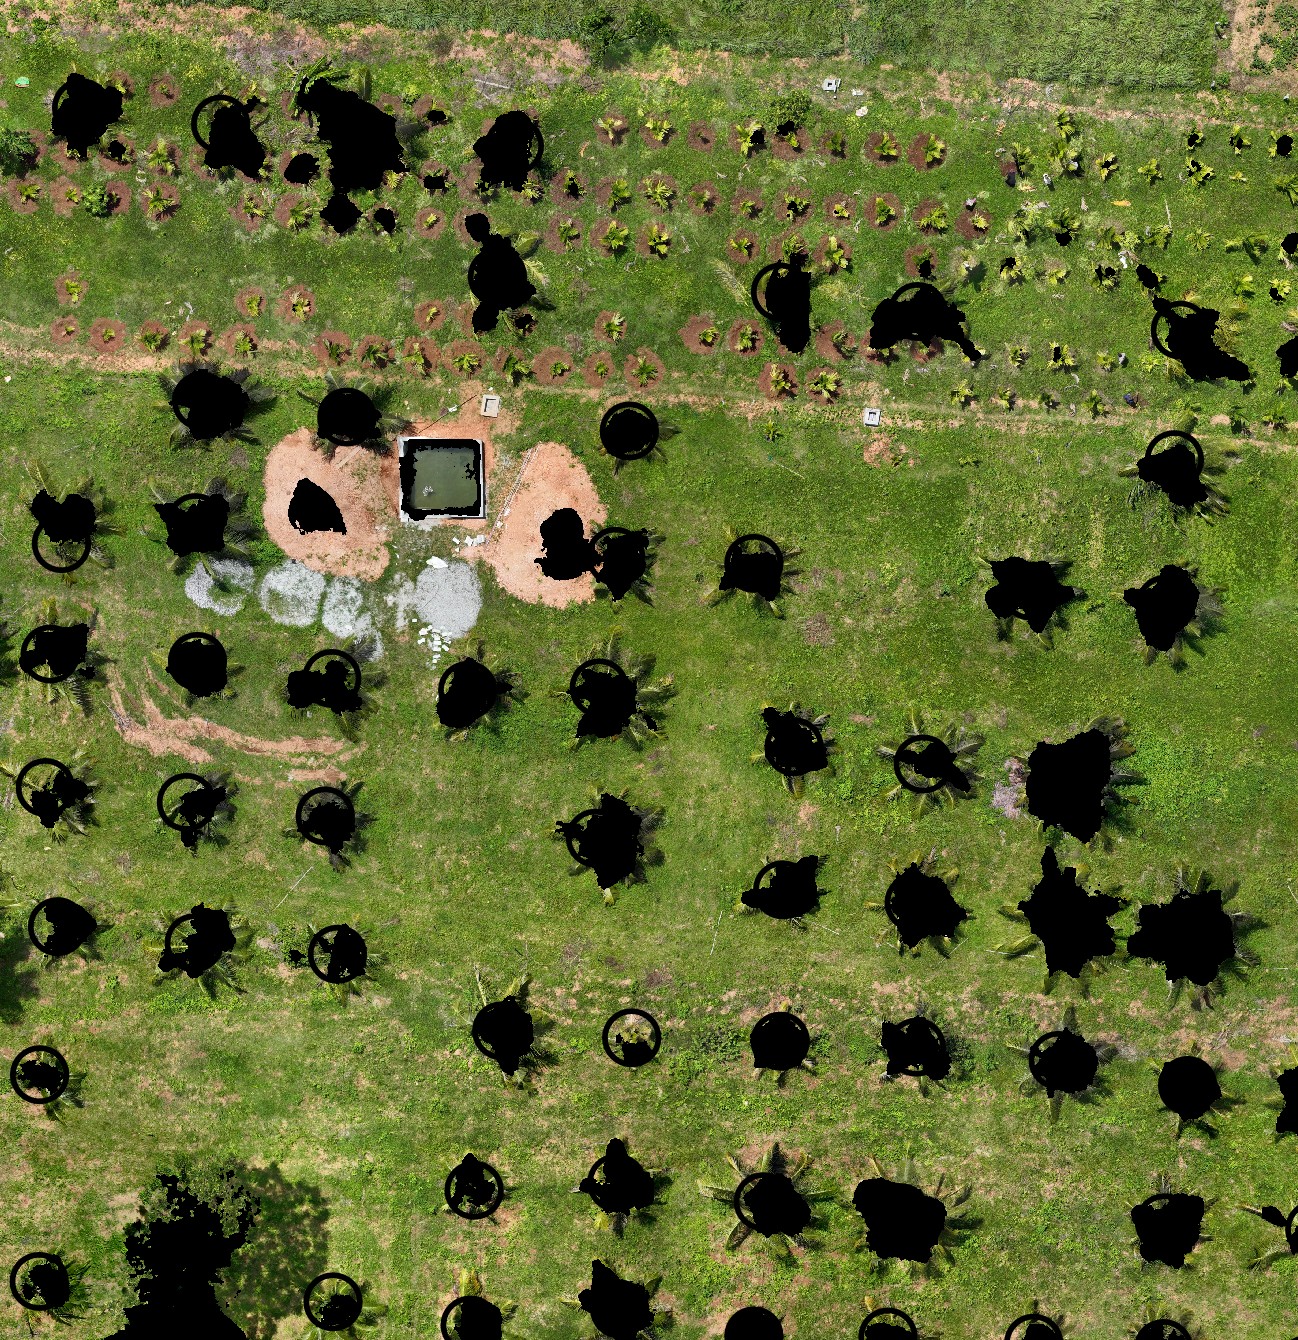
Both together — this is what the script actually samples: canopy mask pixels falling inside each crown polygon:
Why median, not mean?
Median is more robust to outliers. A few very low-NDVI pixels (dry spots, exposed rock) or very high pixels (specular reflection) within the canopy won’t skew the median the way they would a mean. For health comparisons across plots, median NDVI is generally the more stable metric.
Typical NDVI values to expect
| Range | Interpretation |
|---|---|
| < 0.2 | Bare soil or stressed/absent vegetation |
| 0.2–0.4 | Sparse or stressed canopy |
| 0.4–0.6 | Moderate healthy canopy |
| > 0.6 | Dense healthy canopy |
Exact thresholds vary by crop, sensor, and atmospheric conditions.
Get the script
canopy_ndvi_median_calc.py is part of the Drone Mapping, Terrain & Multispectral Analysis QGIS Package — all 16 QGIS automation scripts at $99 USD.