

The Basic Drone Mapping Package
Your land, measured, and kept on record
One precision drone survey gives you an accurate, in-depth ground truth of your property: maps you can print, a report you can read, and an online dashboard you can explore in 3D. Map it again later, and every change can be measured.
5 working days
from flight to delivery
1 year free
online dashboard, renew yearly after
1 year
we keep your survey data
Priced by area
ask us for a quote
What's in the package
01
Area & core maps
True area, high-resolution aerial map, ground and surface elevation.
02
Survey report
PDF analysis of terrain, canopy, water and sun.
03
Online dashboard
Three interactive views of your land. First year free.
04
Ground truth
A dated, precise record for documentation and land records.
05
Change over time
Re-survey and measure what changed.
+
ThotaTracker
Connect your mapped blocks to your harvest and cost records.
01 — Area & core maps
The foundation layers of your land
Every survey starts here: an exact measurement of the ground and everything growing on it.
Surveyed area
Flat and slope-correctedThe measured area of your boundary, given two ways: the flat map figure, and the true ground area on your slopes. On hilly land these differ, and the second one is the figure that matters for planting and inputs.
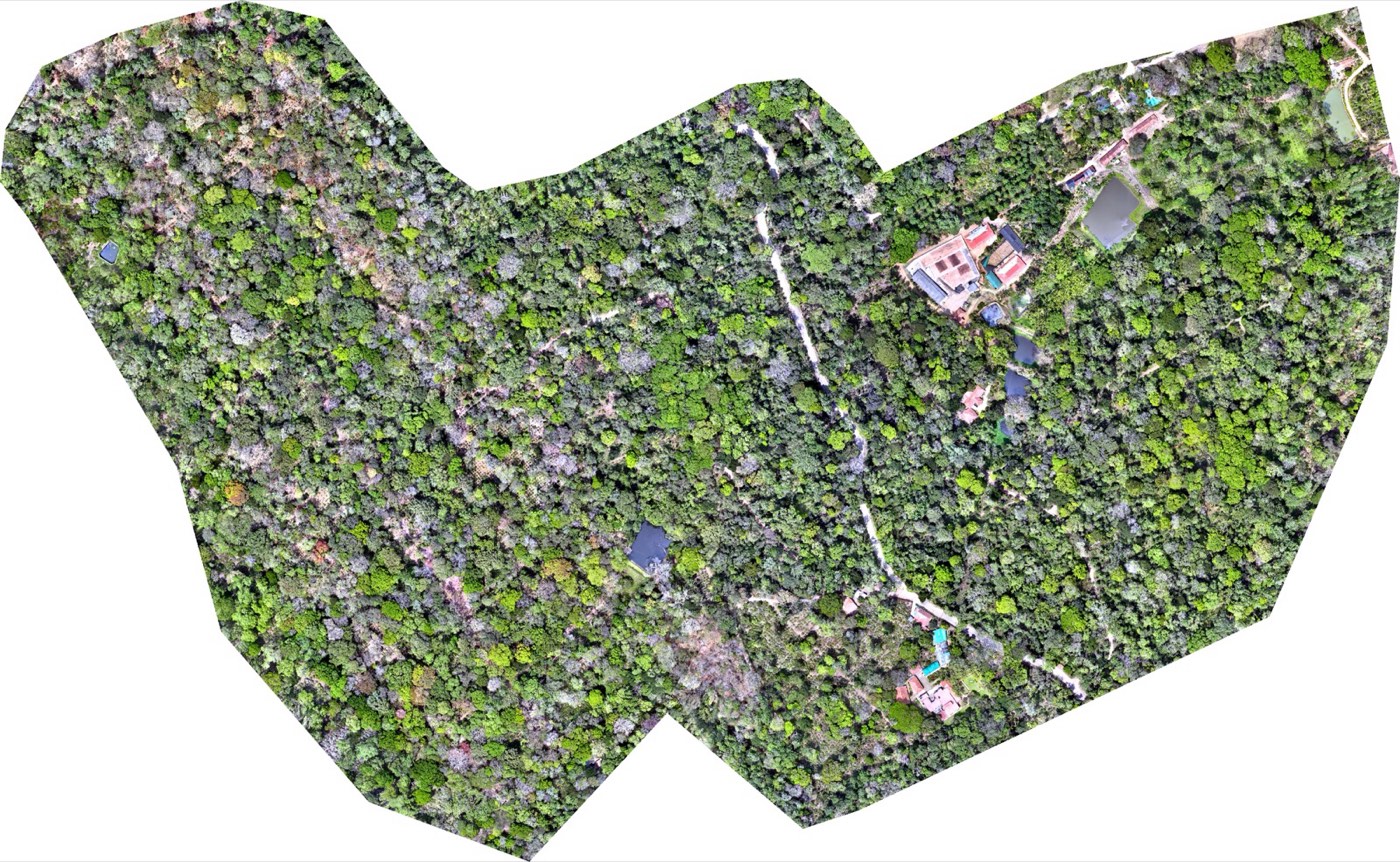
High-resolution RGB map
OrthomosaicThe whole property as one georeferenced aerial photograph, a few centimetres per pixel. Detailed enough to pick out individual trees, paths, sheds and water bodies.
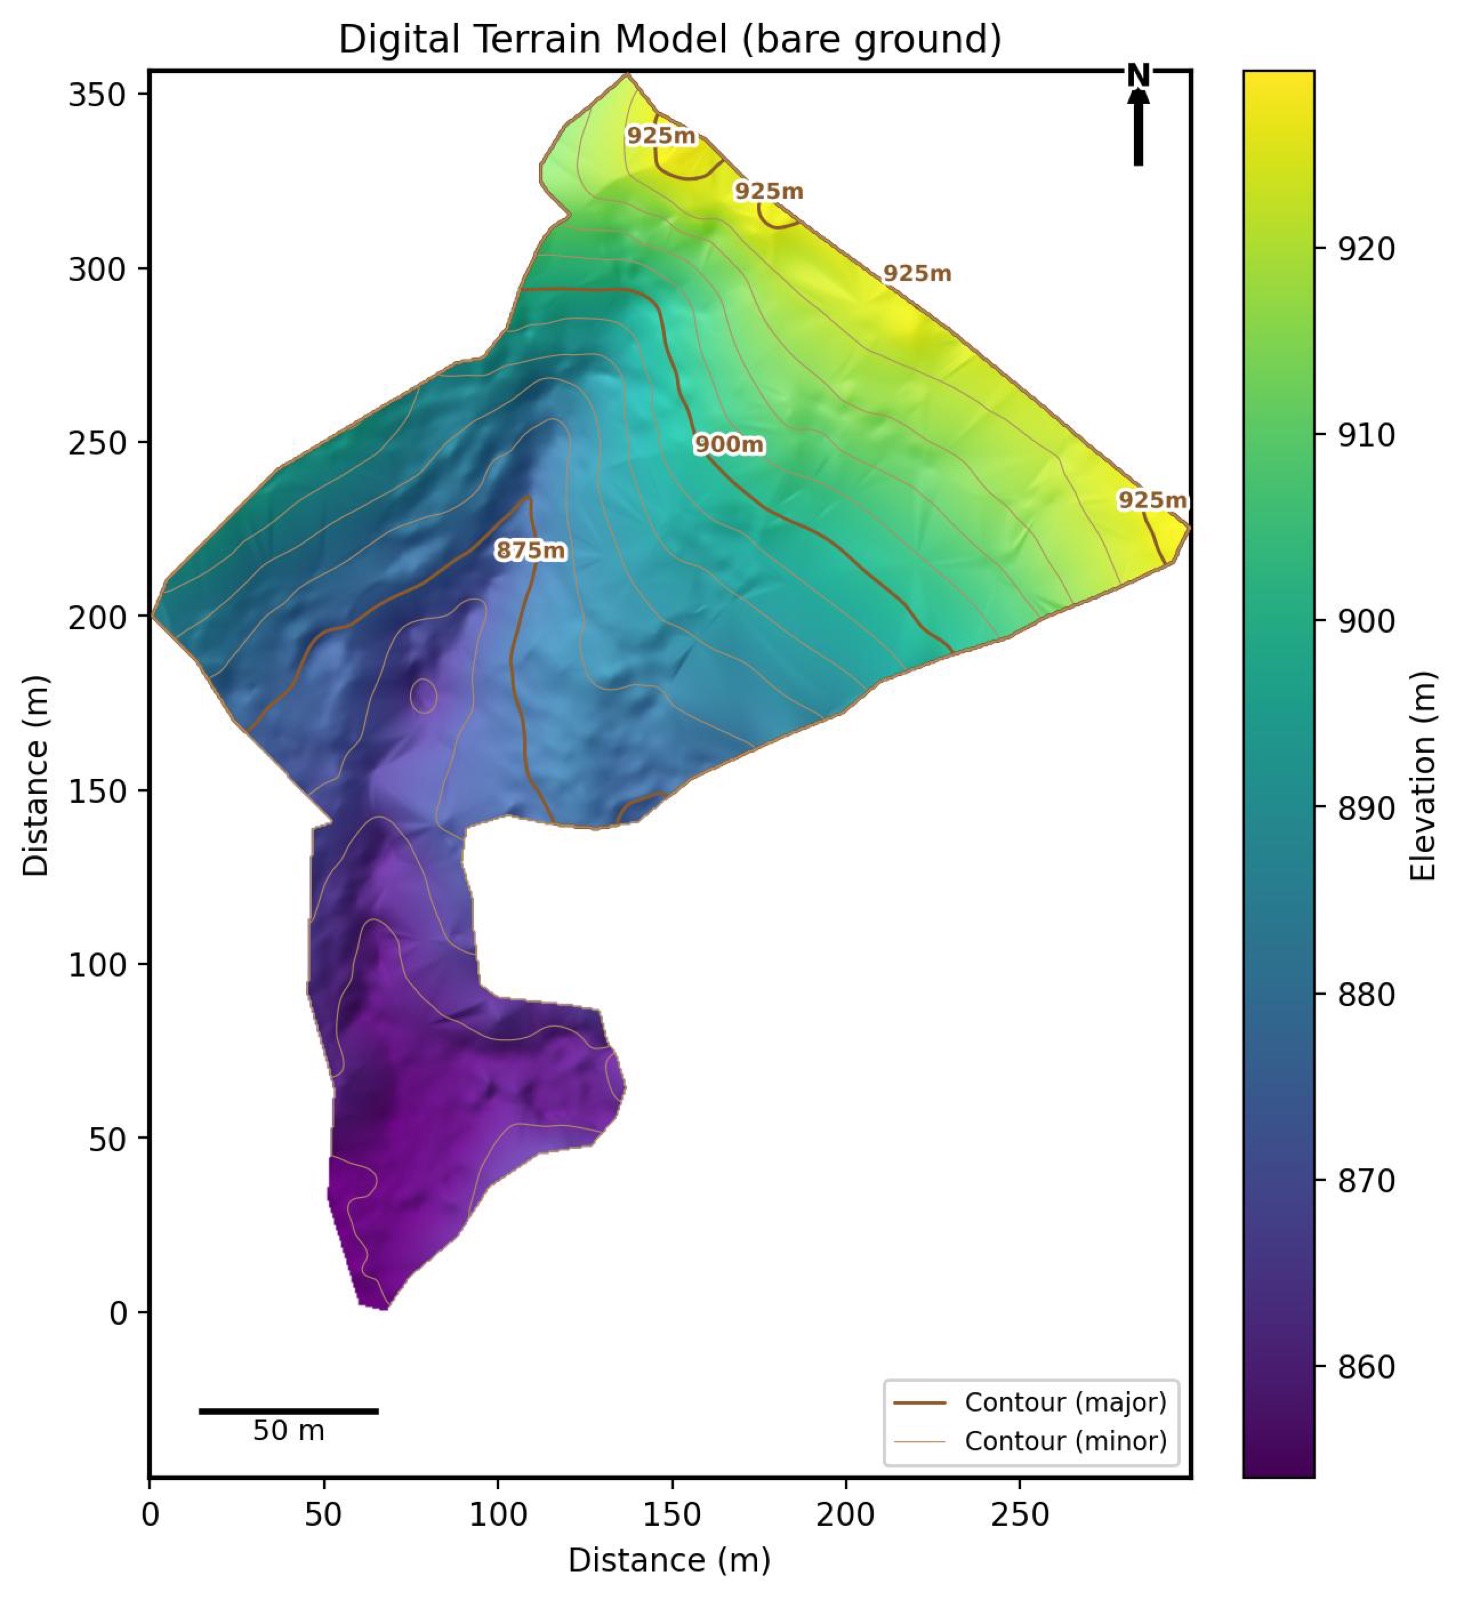
Digital Terrain Model
DTM: the groundElevation of the bare ground, with vegetation removed. Shows the true shape of the land: slopes, ridges, hollows and drainage lines.
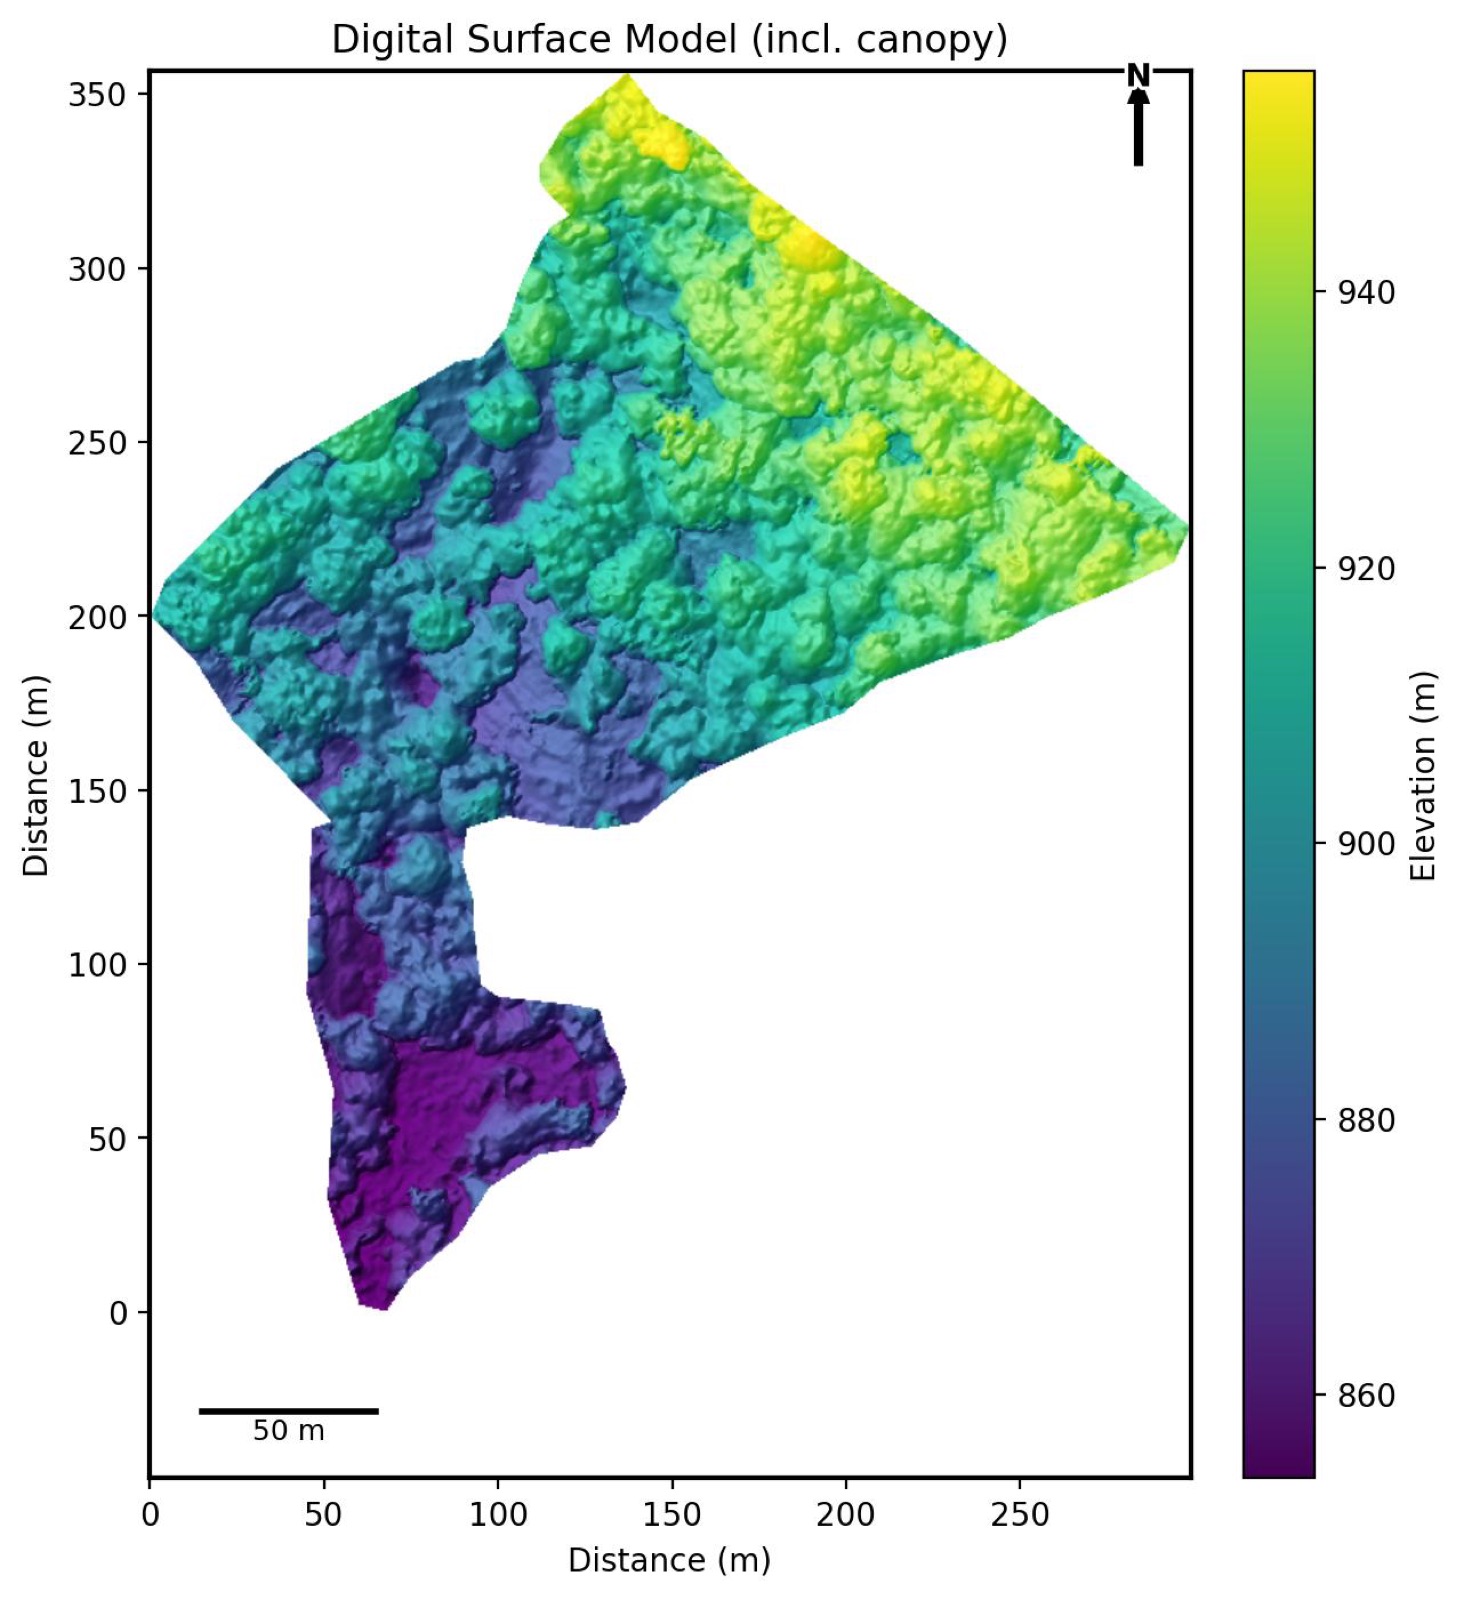
Digital Surface Model
DSM: the canopyElevation of the top surface: tree crowns, buildings, everything standing. Compared with the DTM, it shows how tall the vegetation is.
Print-ready PDFs
One per mapEach map as its own high-resolution PDF with scale bar, north arrow and legend, ready to print large and pin up in the office.
Positioned to the centimetre
Surveys are flown on automated flight paths with RTK GPS correction, so every map lines up exactly with the next. This is what makes a later survey directly comparable with this one.
02 — The survey report
What your land is telling you
A PDF report built from your own maps, with the same core analysis for every survey.
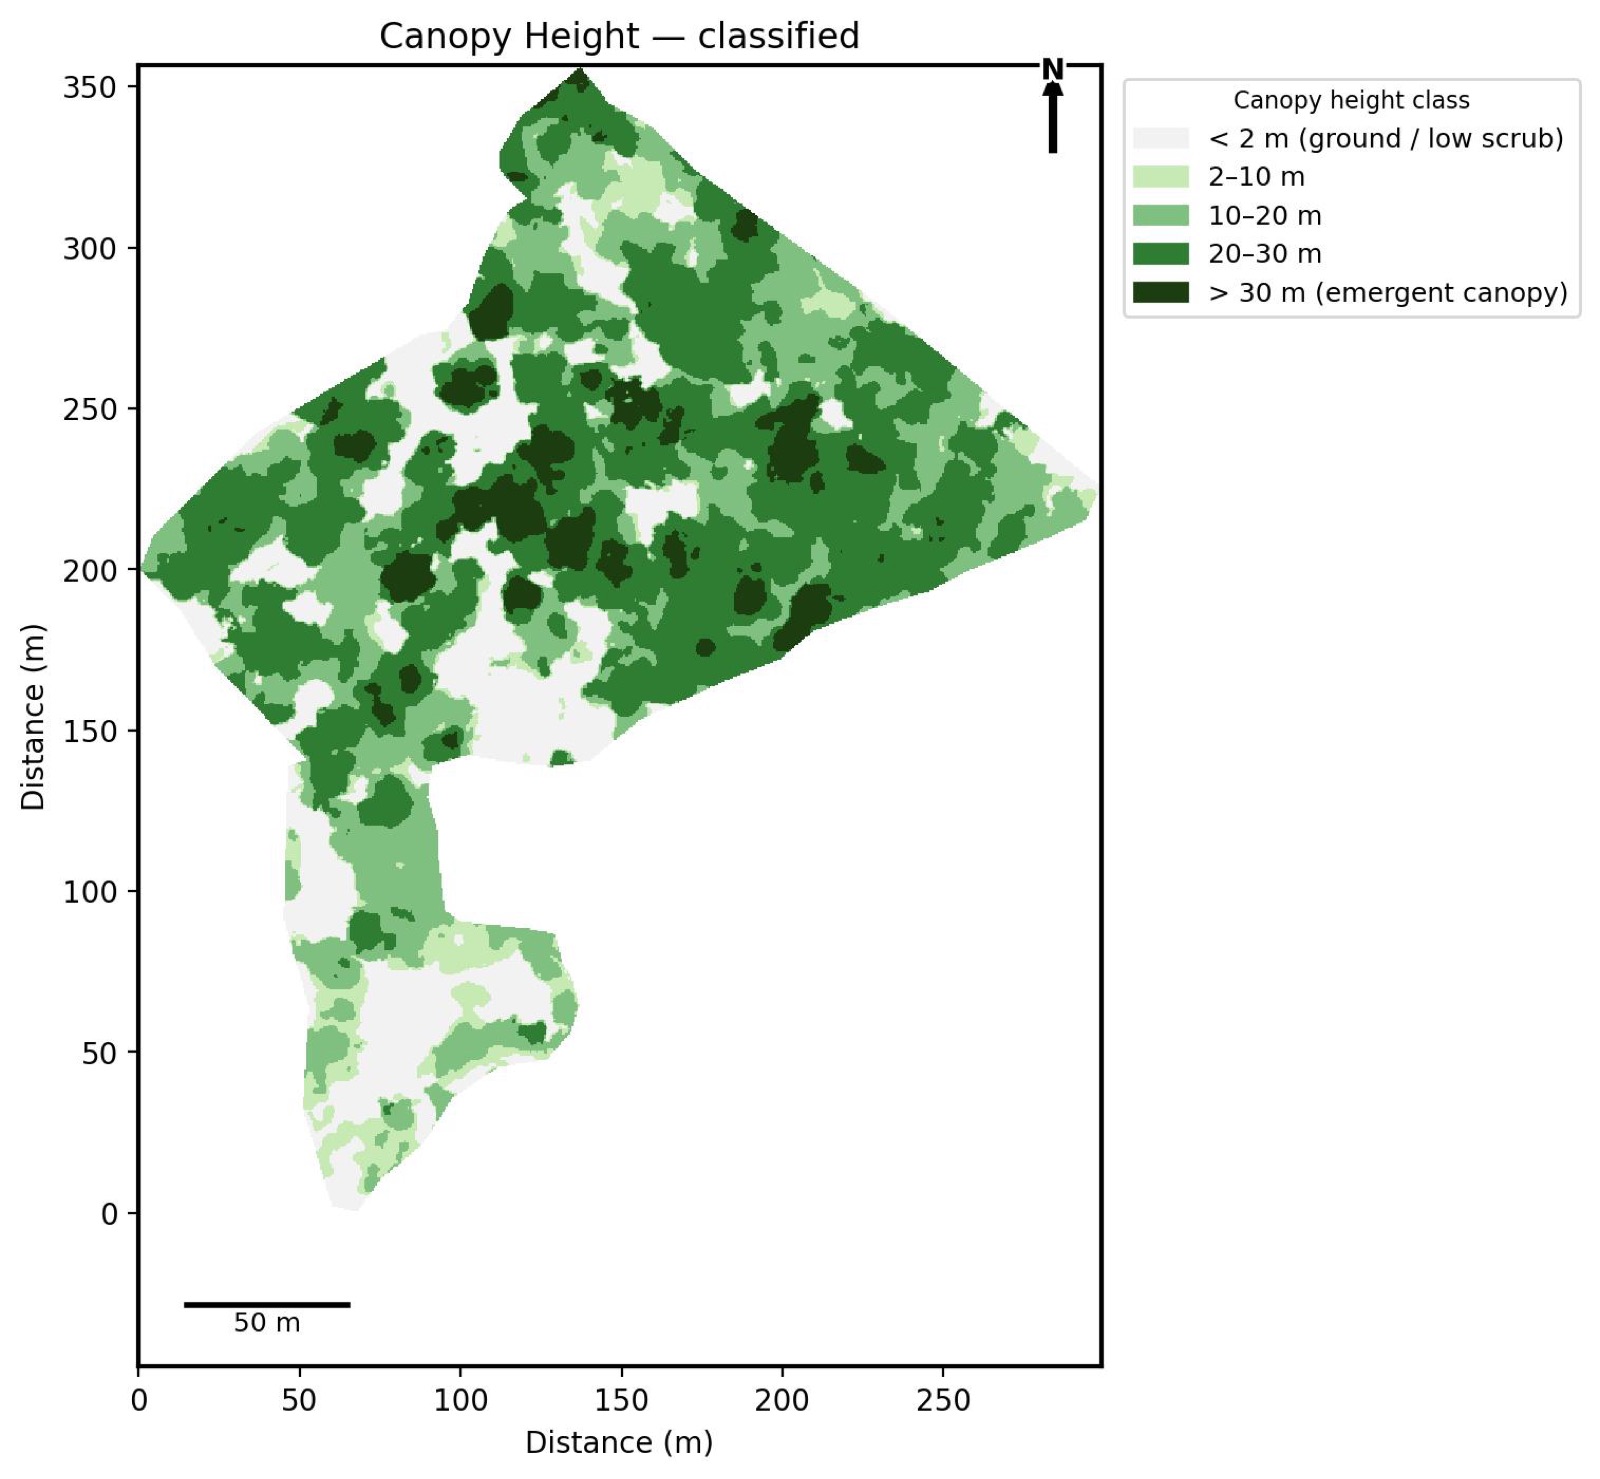
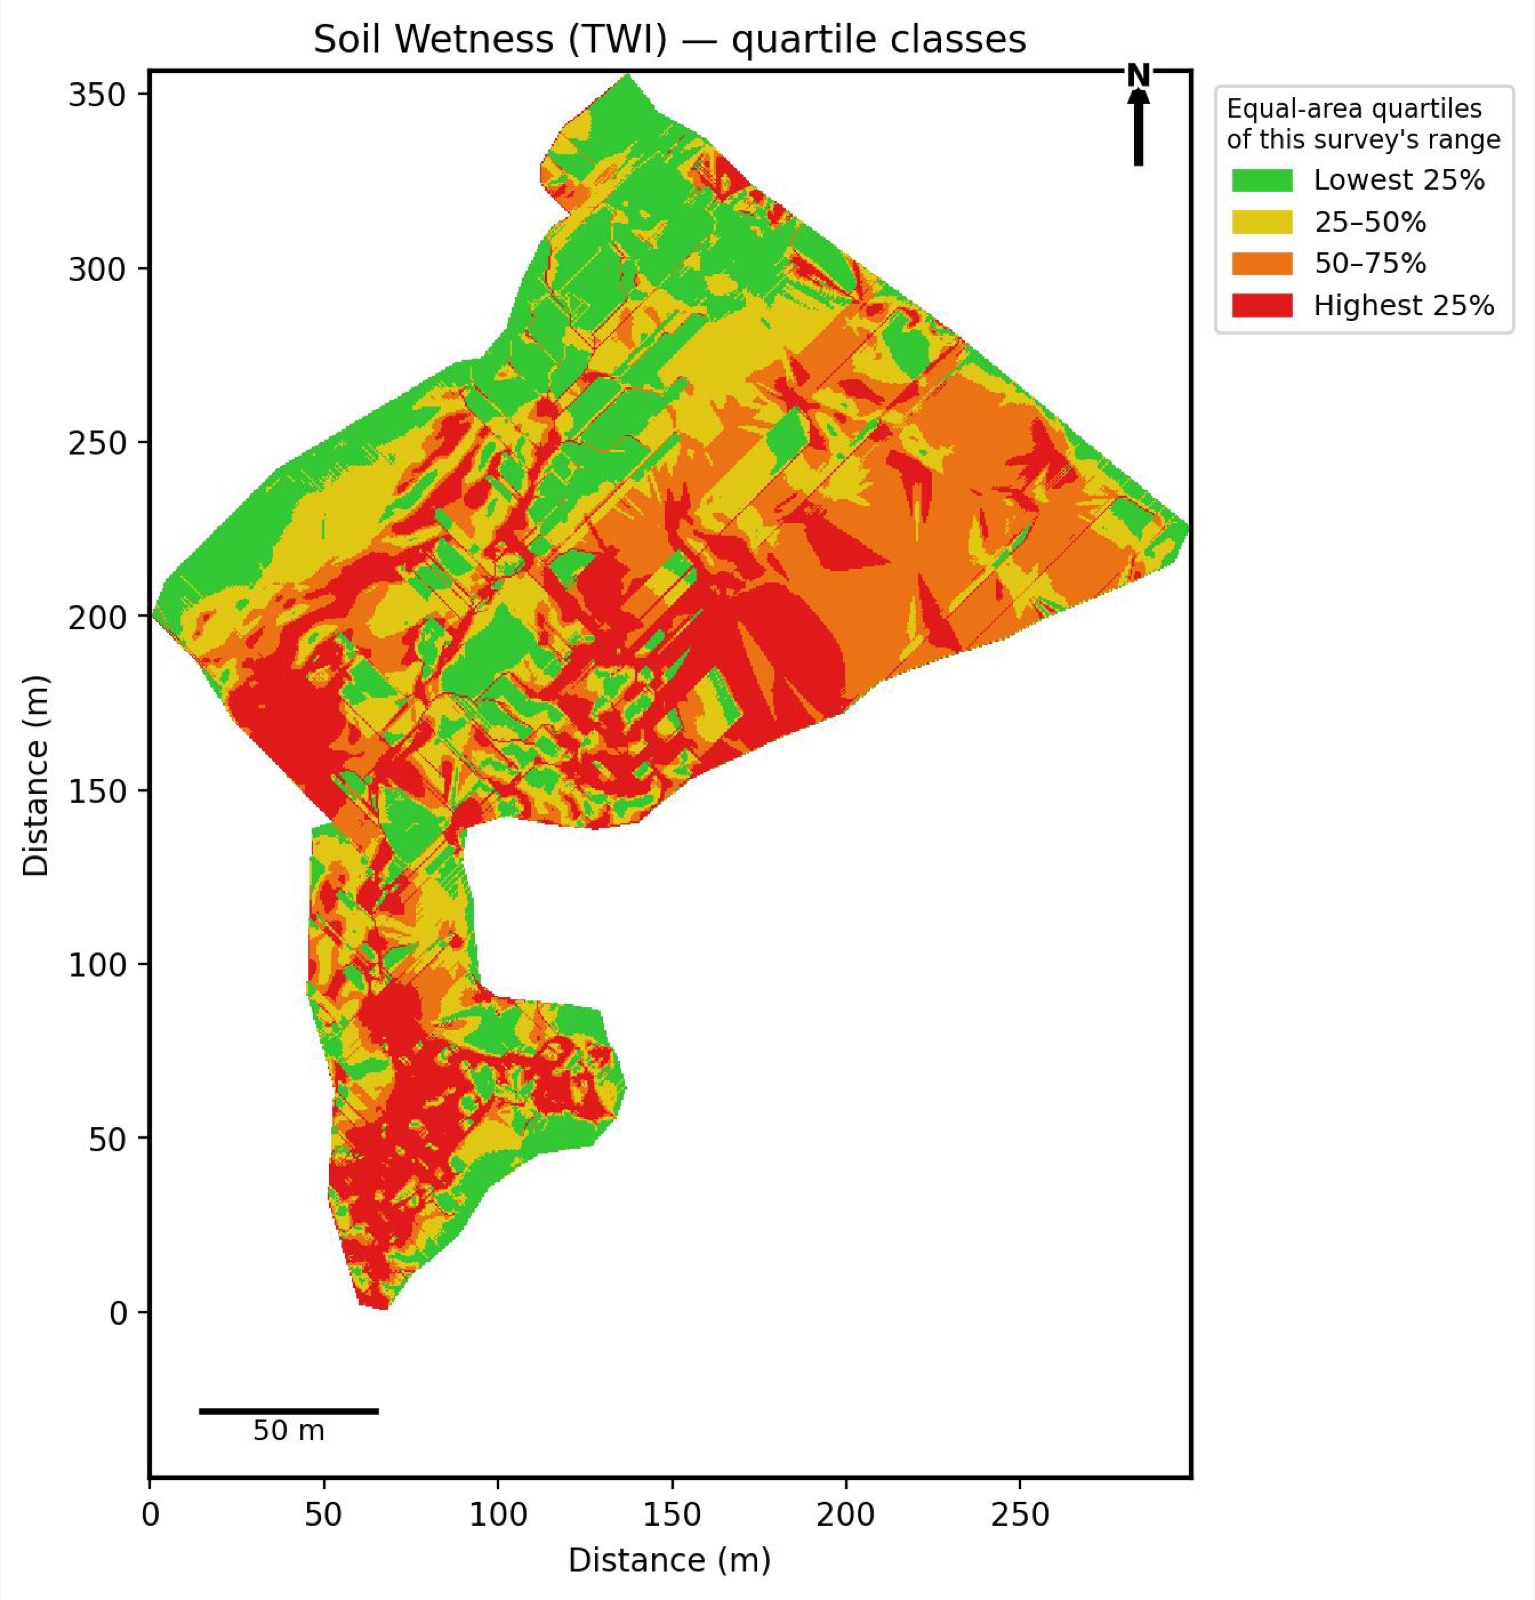
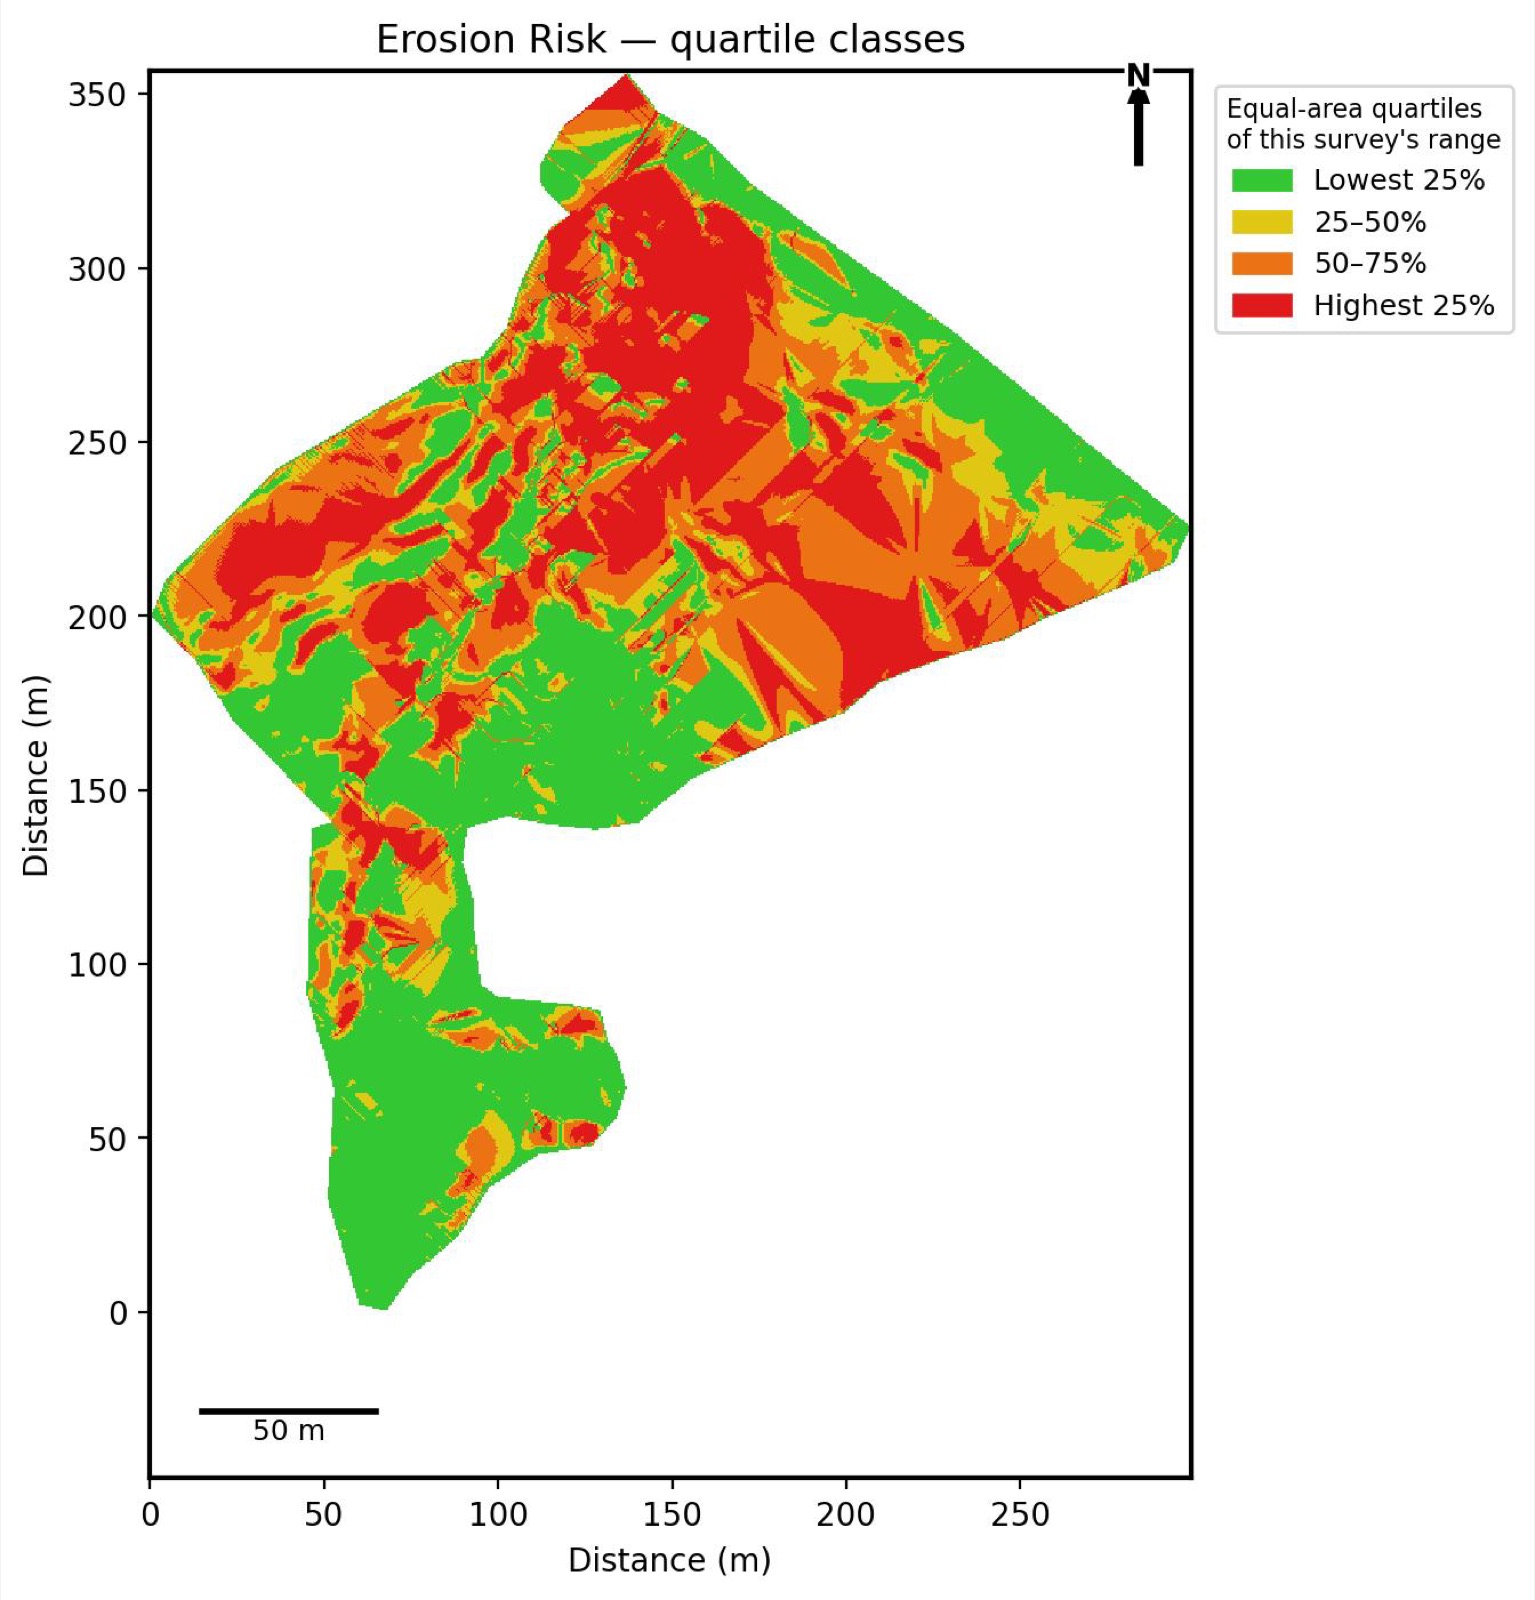
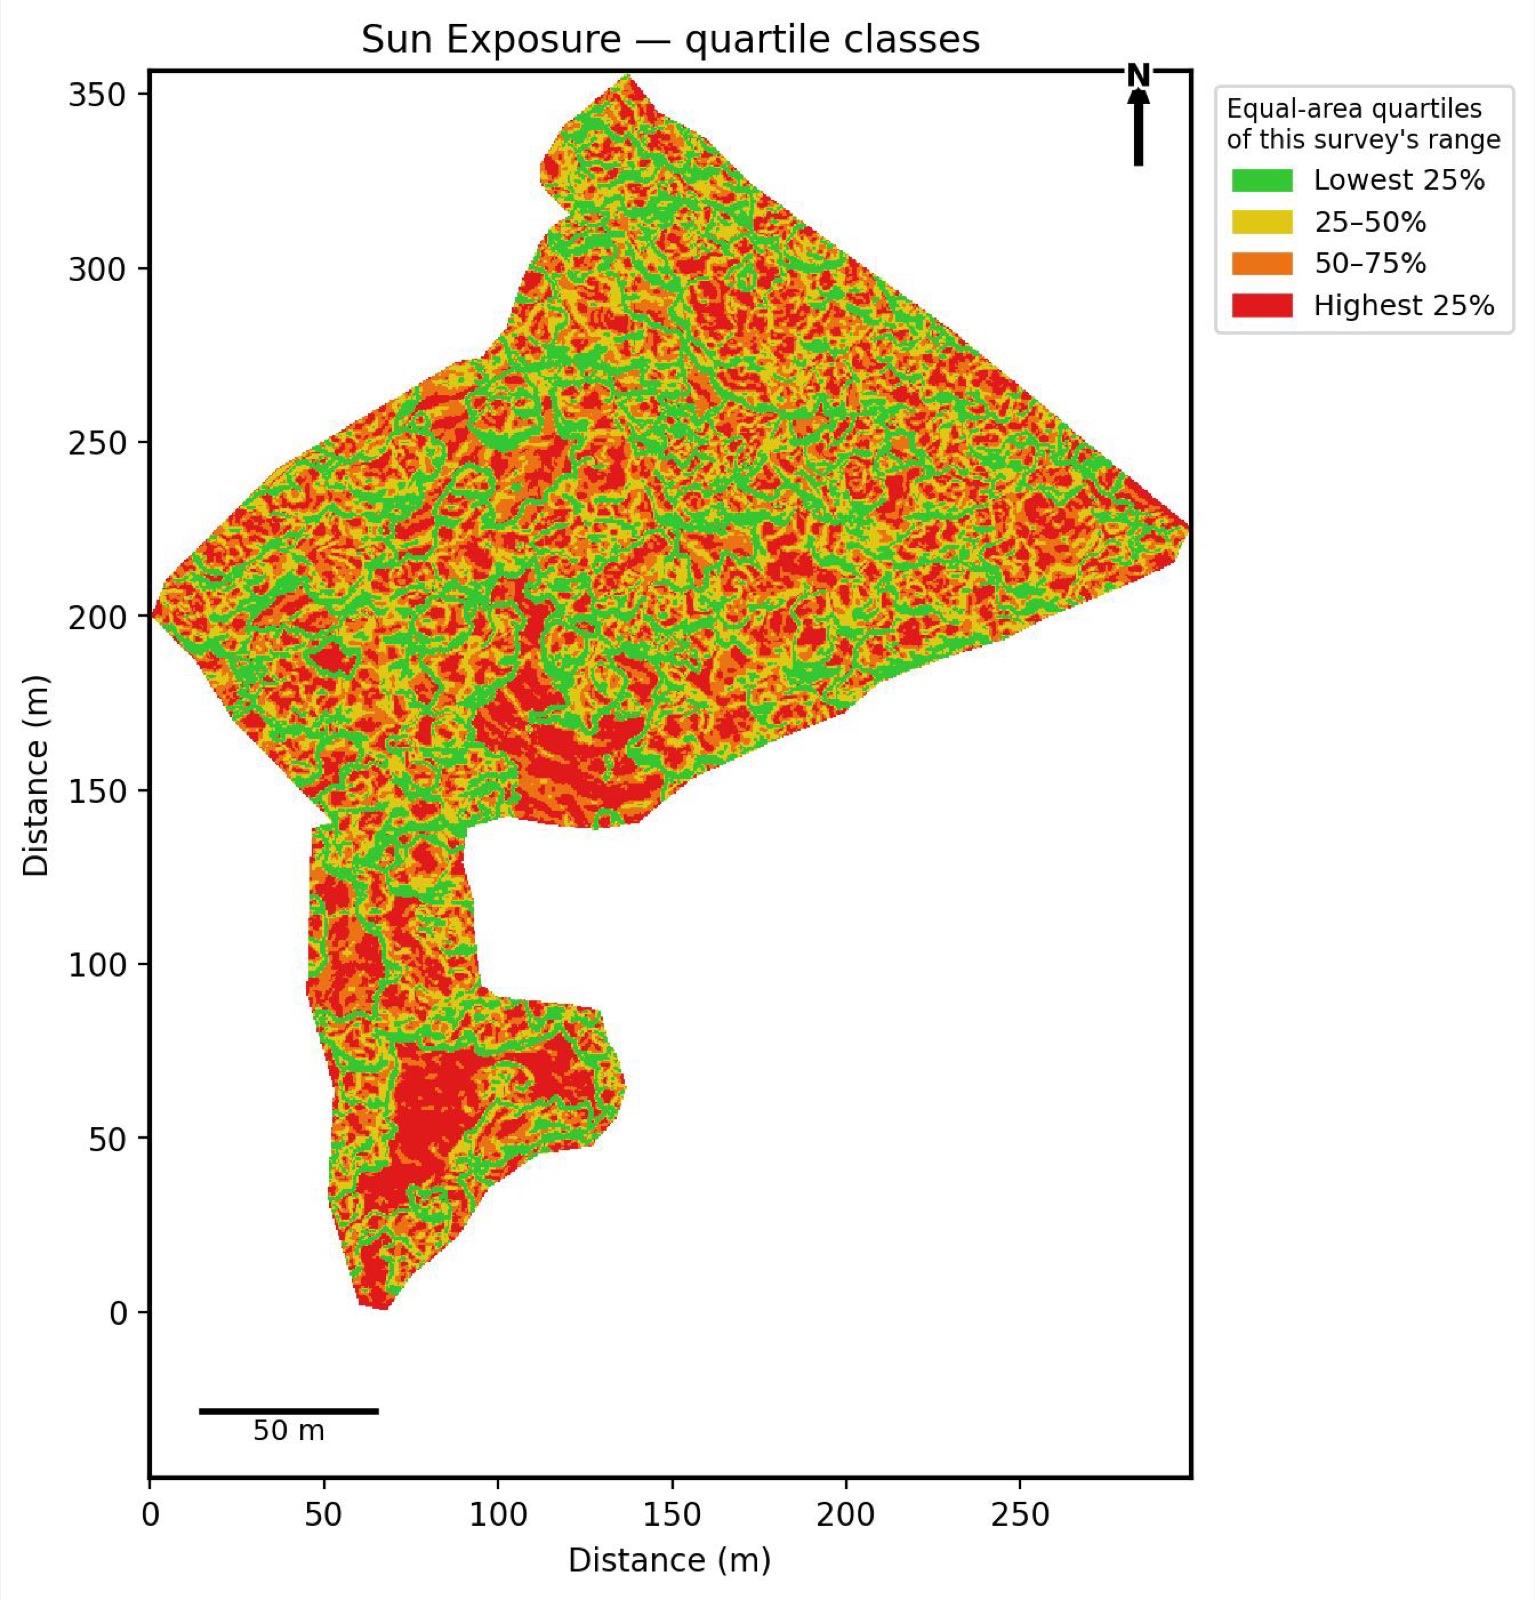
Every report includes
- Area summary: flat and slope-corrected acreage.
- Elevation: highest and lowest points, overall rise, contours.
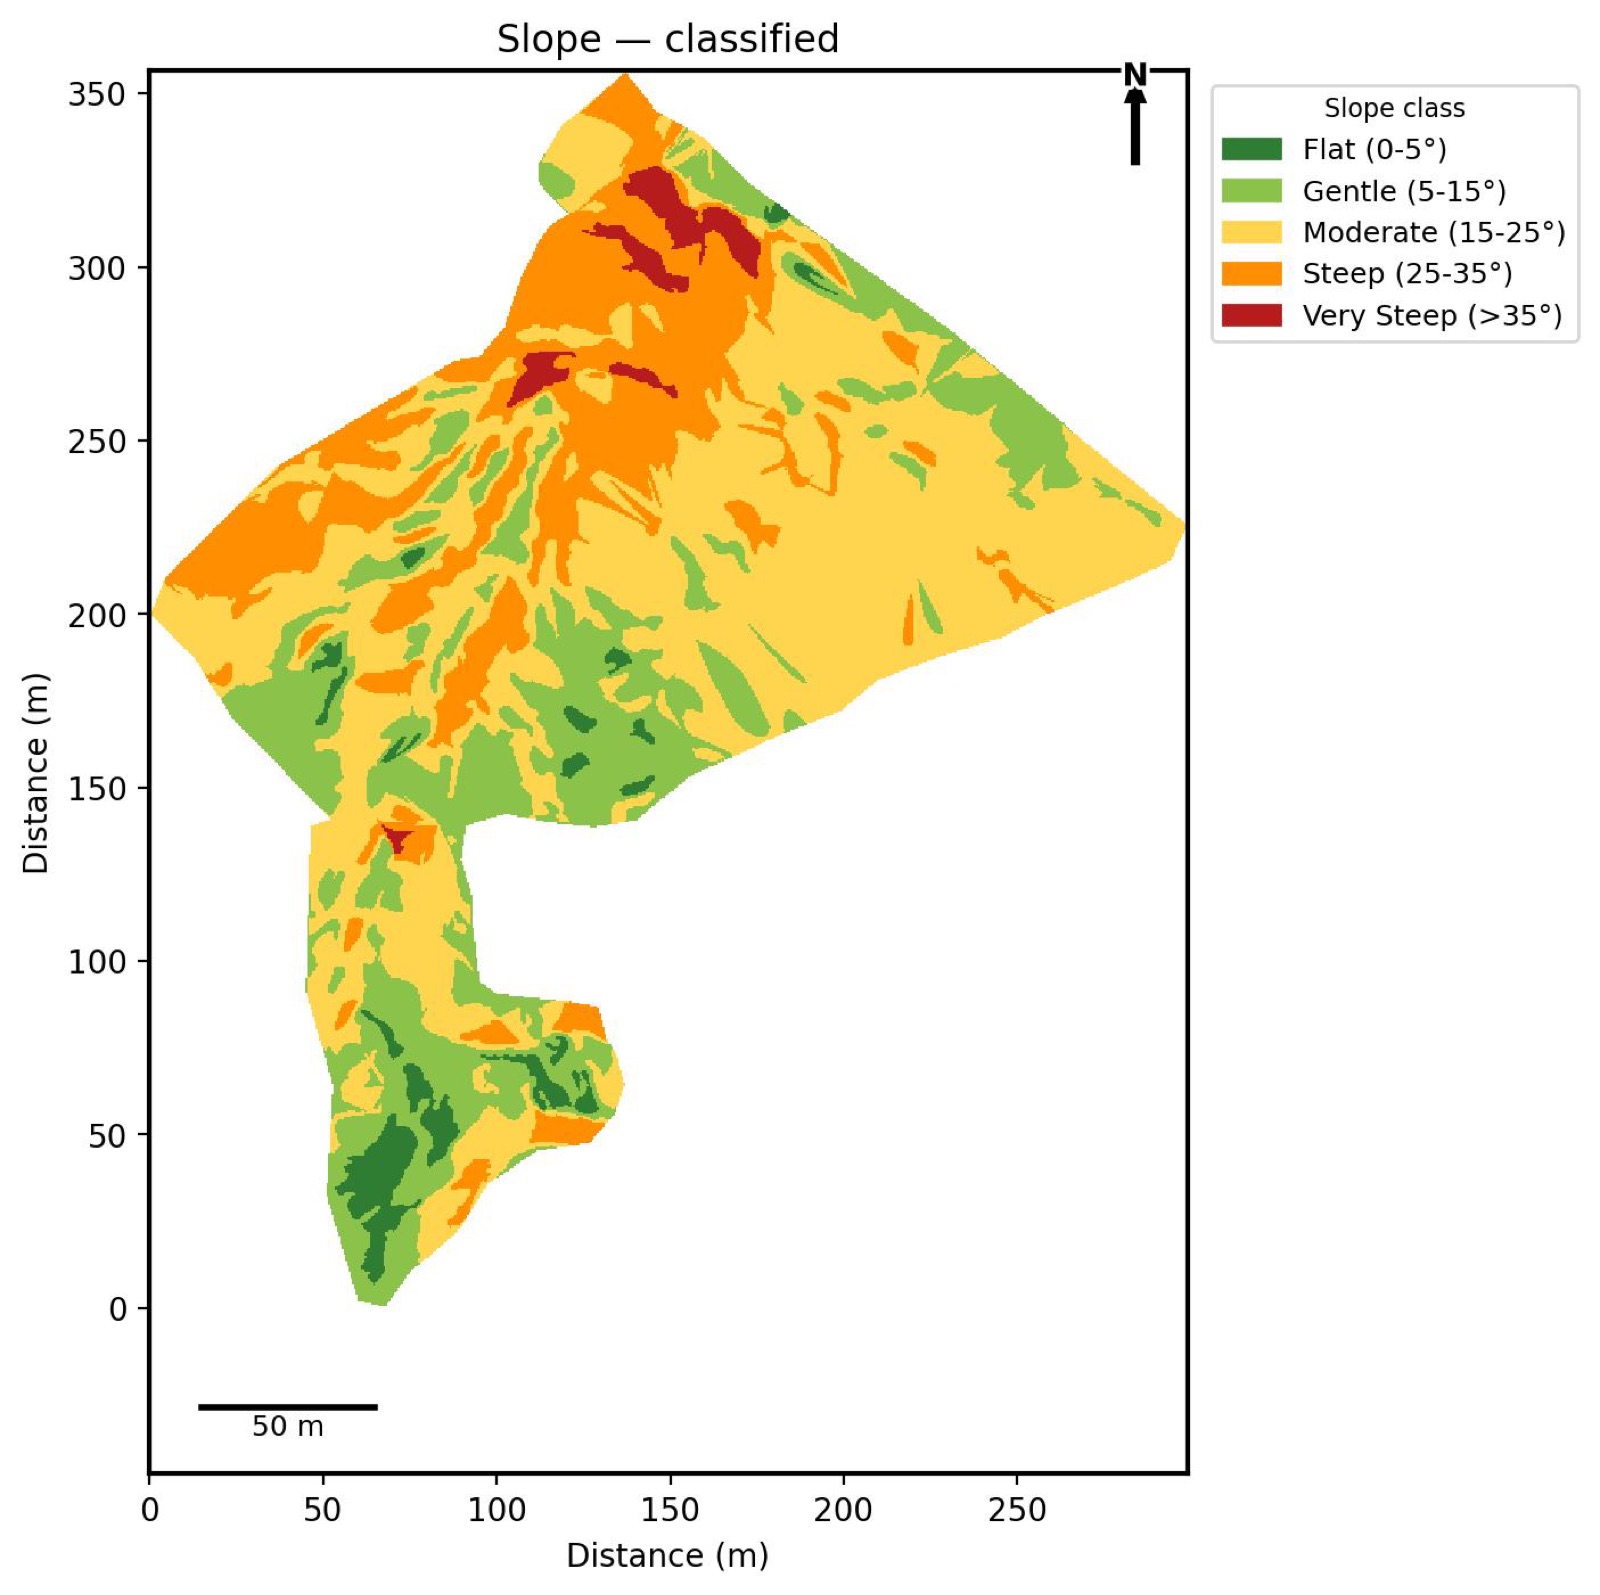
- Slope and canopy tables: acres in each class.
- Water, erosion and sun: how each pattern is spread across the site, including the direction rain runs off.
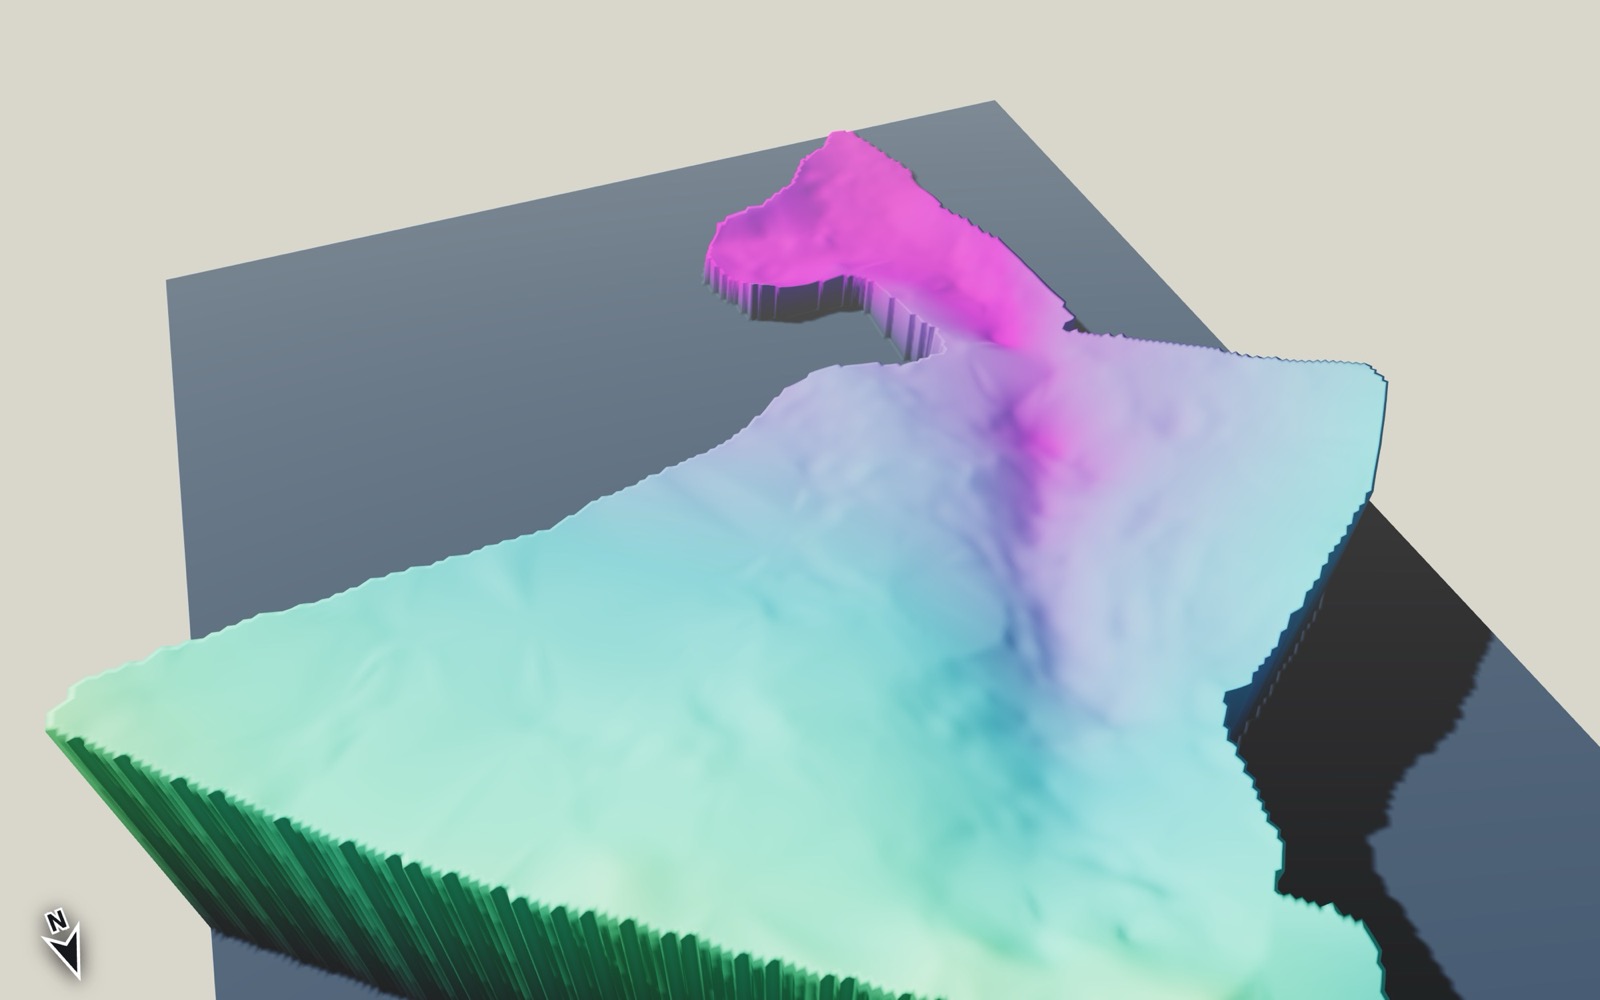
- 3D views: of the ground and canopy from several angles.
What the report doesn't do
The report describes what was measured. It does not tell you what to do with your land. If you want crop-siting zones or planting guidance, we add it on request, based on these same layers. See add-ons below.
03 — Online dashboard
Explore your land, not just read about it
Three interactive views of your property, opened in any web browser. Nothing to install.
1 year free with every survey · renew yearly after that
A
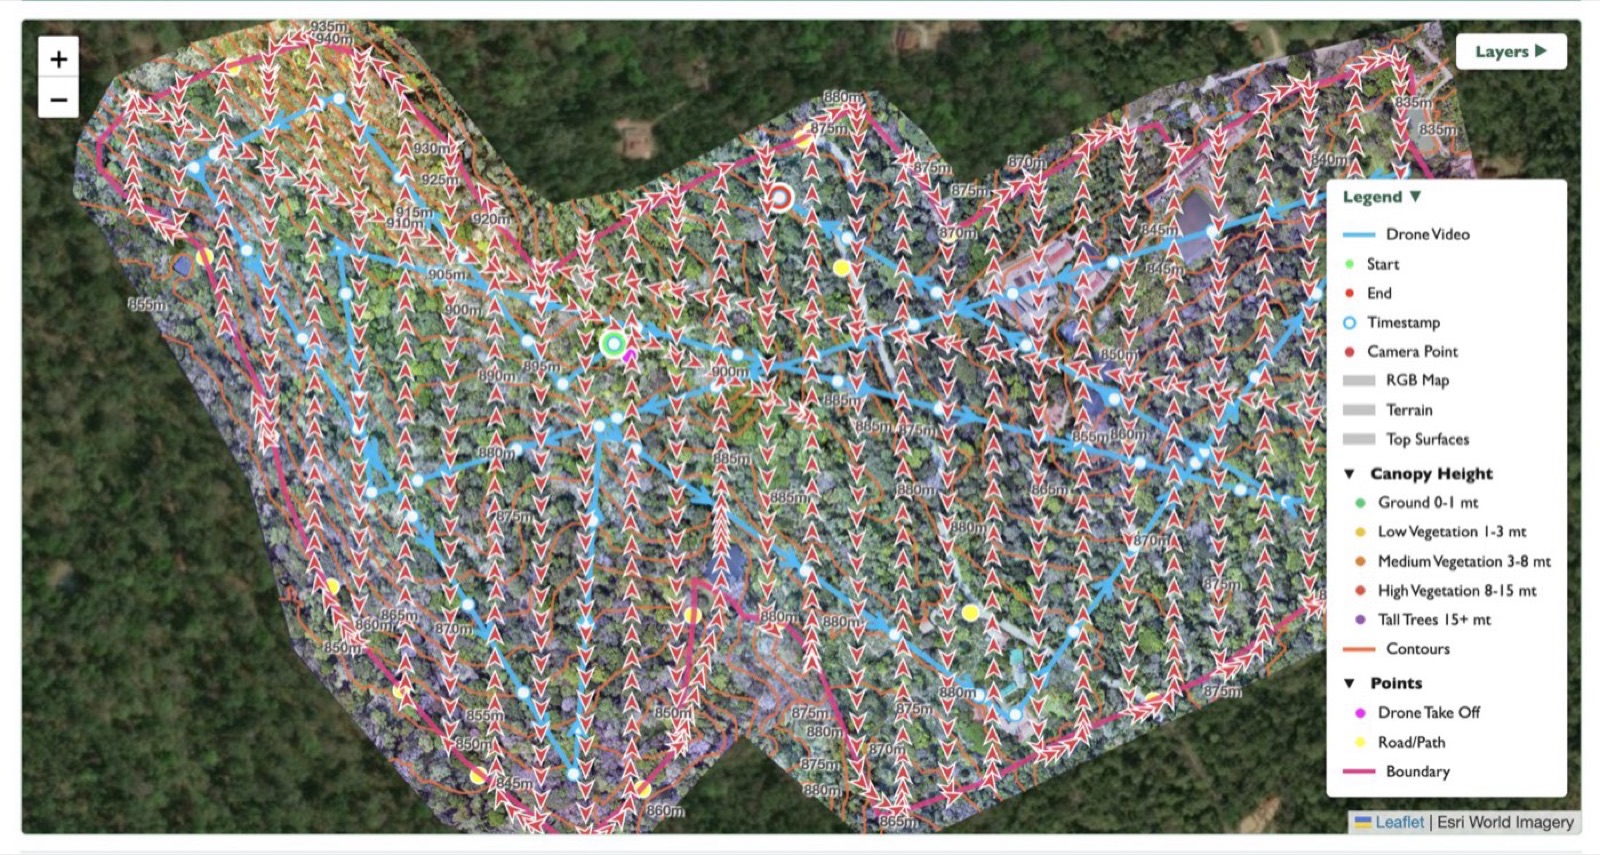
Drone Media Map — everything in one place
- All map layers, stacked. Aerial photo, DTM, DSM and analysis layers on top of each other. Switch between them in one click.
- Photos and video, pinned. Every drone photo and the flight video placed where it was taken. Click a point to see it.
- Mark it up yourself. Draw block-wise polygons, boundaries and notes, then export them.
B
3D Terrain Model — see how the land behaves
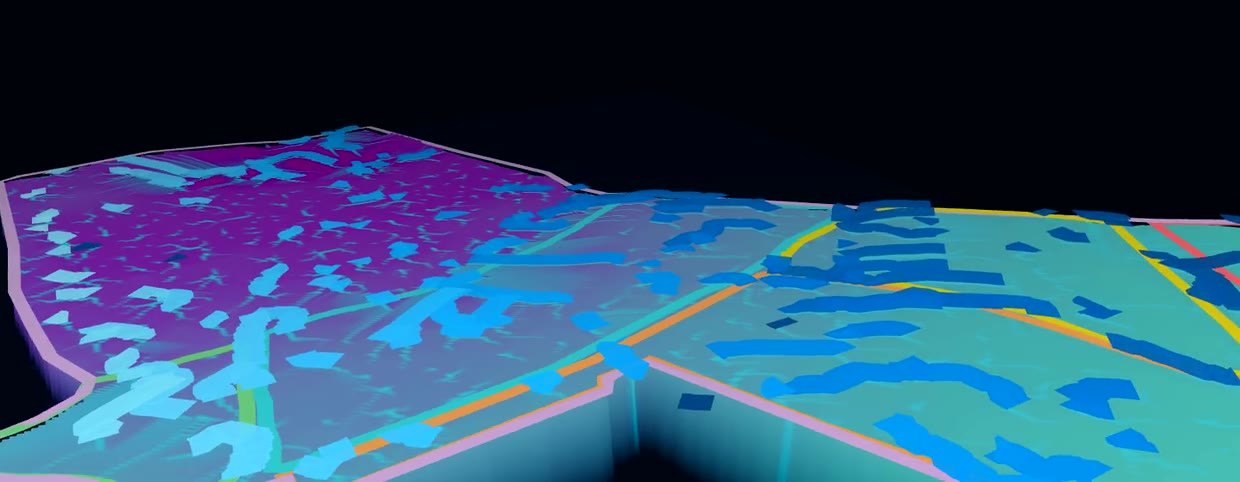
Moisture retention and erosion risk are read from the shape of the terrain too. Tilt, spin and zoom the model: it shows gentle slopes and drainage lines exactly as they are, including ones that are hard to notice when you're standing on them.
C
3D Digital Twin — your land, in true colour
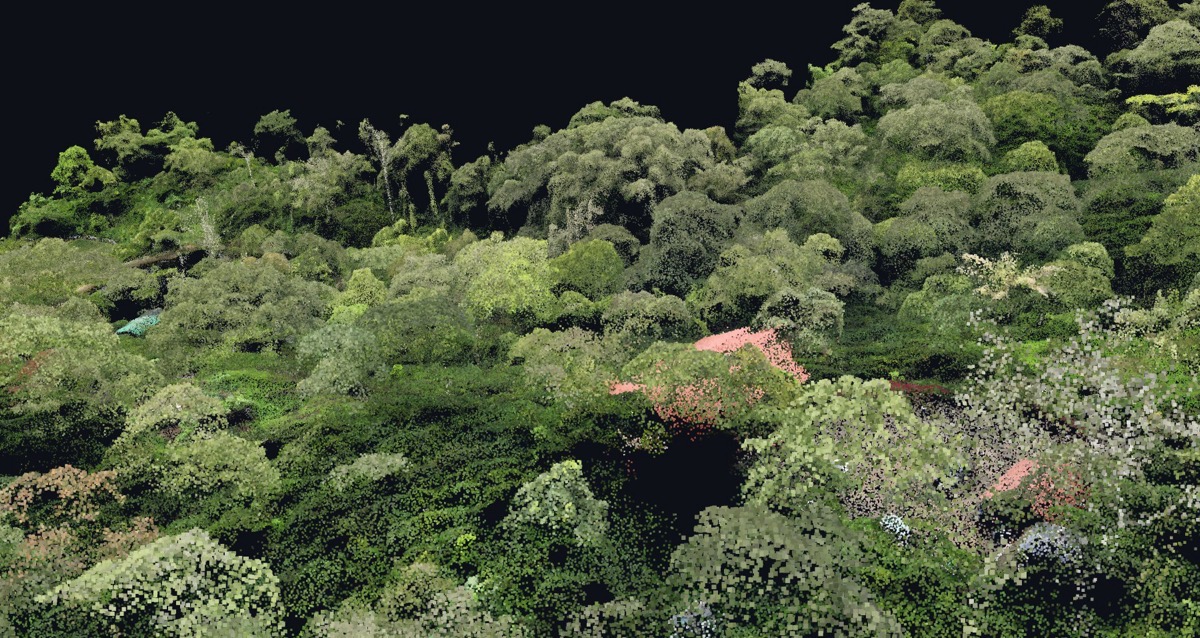
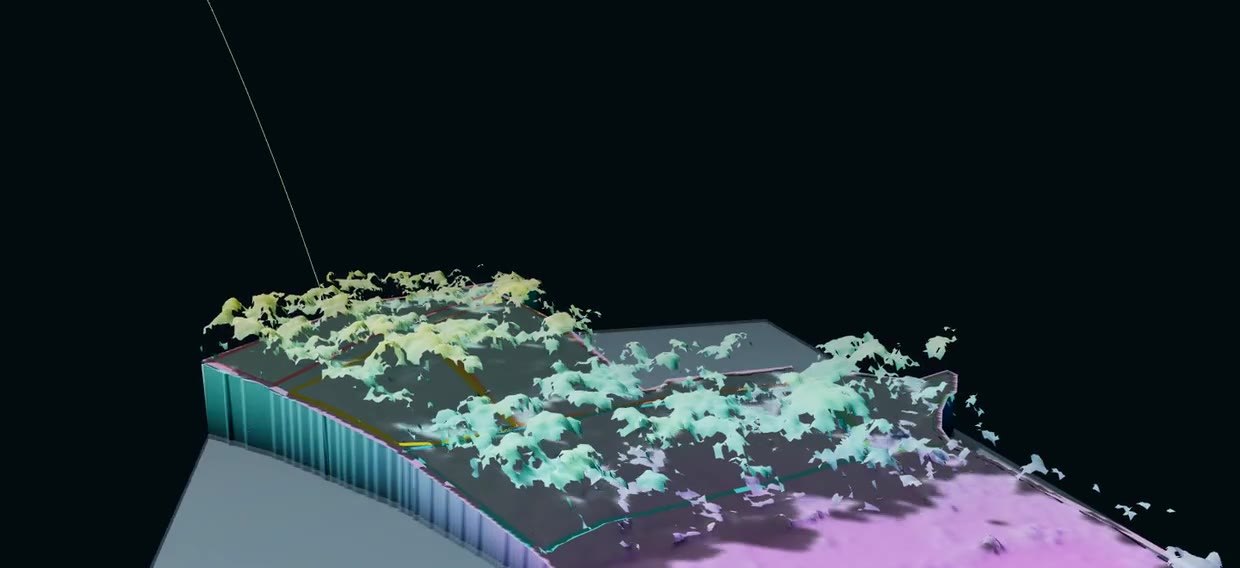
Millions of measured points in true colour: individual tree crowns, the canopy layers and the buildings, seen at an angle. Rotate to any angle and zoom in anywhere.
Built to keep improving
We keep adding to the dashboard, so it gets easier to make decisions from your survey over time. Your subscription includes those improvements as they ship.
04 — Ground truth
A precise record of your land, as it is today
Not a sketch or an estimate. Your land, measured and dated.
Documentation
A dated record of the property: boundary, area, trees, buildings, water. Useful for the family, for succession, or when selling or leasing.
Land records
An accurate, georeferenced map to set beside survey sketches and revenue records, or to share with a surveyor, banker or buyer.
A baseline for later
Today's survey is the reference point every future survey is compared against.
05 — Track change over time
Map it again. Measure what changed.
Repeat surveys line up to the centimetre, so change is measured, not guessed. Re-survey whenever it suits you: every season, every year, or before and after a major piece of work.
How has shade changed?
Compare canopy height and cover between surveys. See where shade was lopped, where trees have grown, and how much area each change covers.
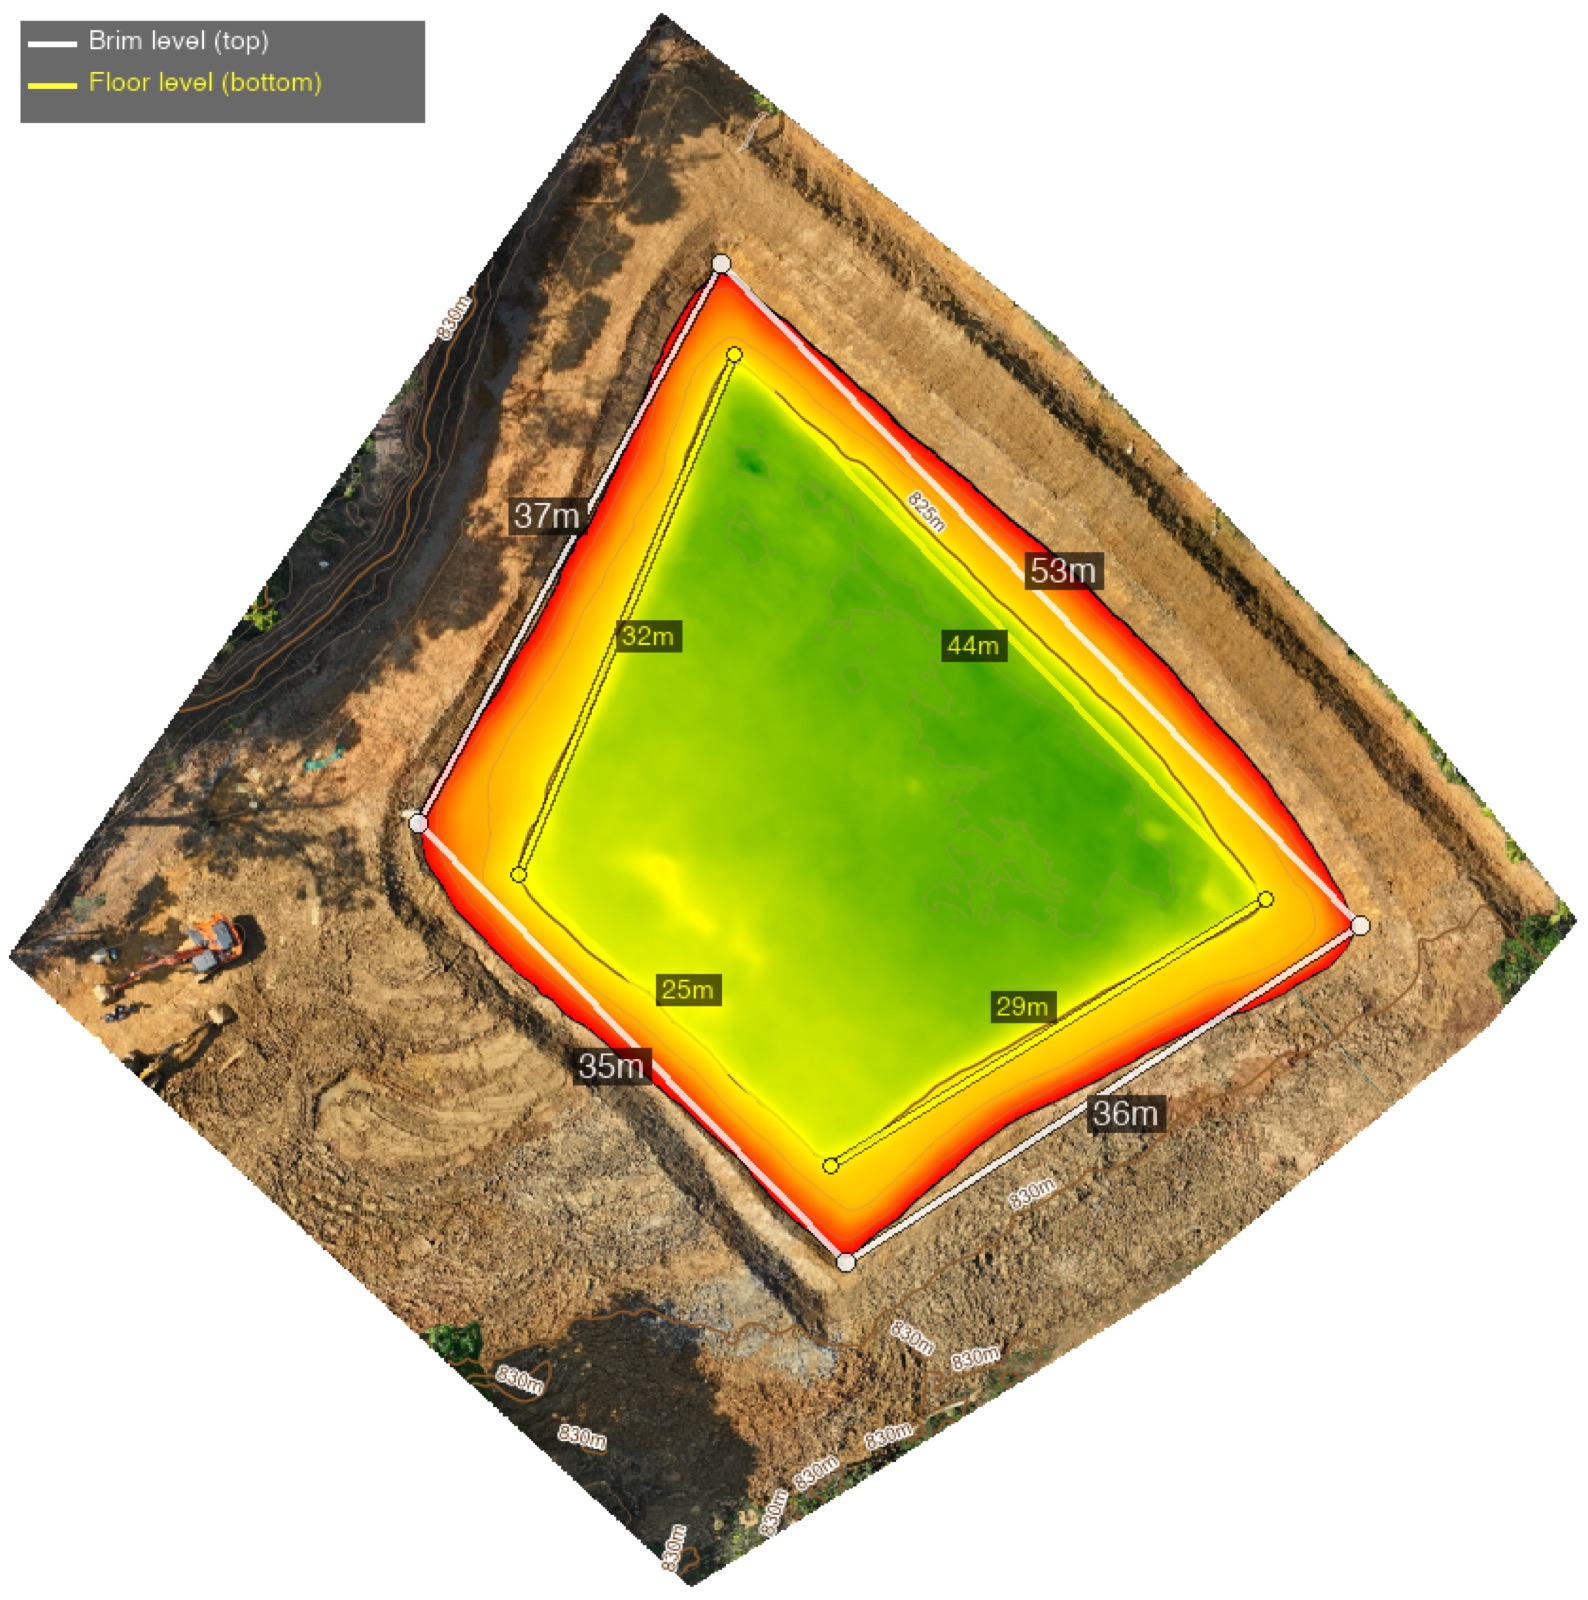
How much is there?
Measure the volume of piles of mud, sand, gravel, compost or waste, or the capacity of a pond or lake, in cubic metres. Track how much has been added or removed since the last survey.
For an accurate figure: piles and ponds must be open to the sky, with no roof or tree canopy over them, because the drone measures only the surface it can see. A pond or lake must also be empty, so the full bed is visible.
Connected to ThotaTracker
From mapped blocks to block-by-block yield
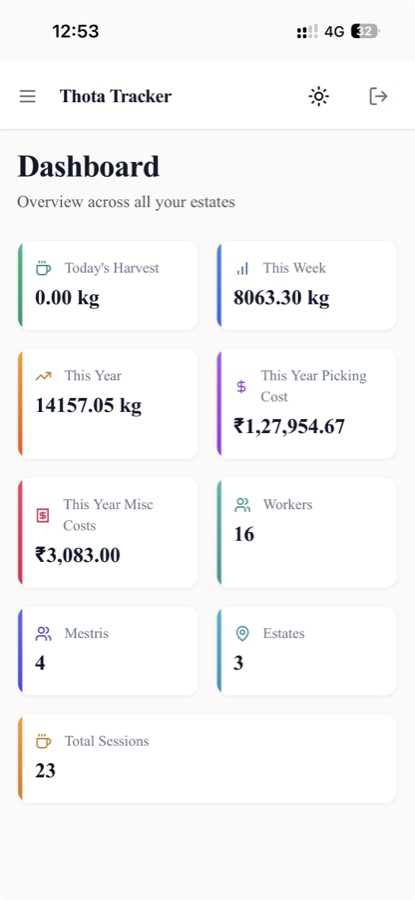
ThotaTracker is our plantation management app. It's live and in daily use on a production coffee estate, keeping digital records of picking sessions, workers, costs and processing, and it works offline in the field.
Blocks you draw in the Drone Media Map can feed into ThotaTracker, so you can compare yield across the plantation block by block. For this, the harvest needs to be GPS-tracked, so each day's picking can be matched to the block it came from.
Coming next: an AI advisor for your land
You will also be able to ask questions about your land in plain language. The advisor will know its terrain, canopy and water from your surveys, and its yields and costs from ThotaTracker, so its answers are specific to your plantation rather than generic advice. It will be priced separately as an add-on, not part of the basic package.
Not in the basic package
So there are no surprises: these are available, but quoted separately.
Multispectral vegetation health (NDVI / NDRE)
Vegetation-index maps from a multispectral flight. Only meaningful where crops or trees are open to the sky and visible to the drone camera, so on shade-grown coffee it reads the shade canopy, not the coffee beneath it.
Priced on request
Crop siting & planting guidance
The basic report describes what was measured; it does not tell you what to do. On request, we turn the same slope, elevation, moisture and sun layers into crop-siting zones and planting guidance.
Priced on request
Individual tree & plant detection
Per-tree detection and counts from the orthomosaic, for stand density, variety mapping and yield planning.
Priced on request
Video walkthrough
A manually flown video of specific areas of interest, for documenting conditions or for the estate’s own promotion.
Priced on request
How it works
-
1
Share your boundary
A GPS track, a CAD file, or we walk it with you and record the GPS boundary.
-
2
Survey day
Automated flights, usually a single day.
-
3
Delivery
Maps, report and dashboard within 5 working days of the flight.
-
4
Explore
Dashboard included for the first year. Data kept for one year.
Drone Mapping Consulting
If you operate your own drone and want professional-grade outputs, we offer consulting on mission planning, KML boundary creation, photogrammetry processing, and RTK GPS setup. We can set up your GIS workflow end-to-end so you can run repeatable, high-quality surveys independently.
Map your land
Priced by area. Ask us for a quote for your property. 5-day turnaround. 50% advance to book.