

After surveying a valley or reservoir with a drone, you often need to answer: “if the water level rises to 850 m, how far does it extend?” This script answers that directly from your DTM, without needing to manually trace contours.
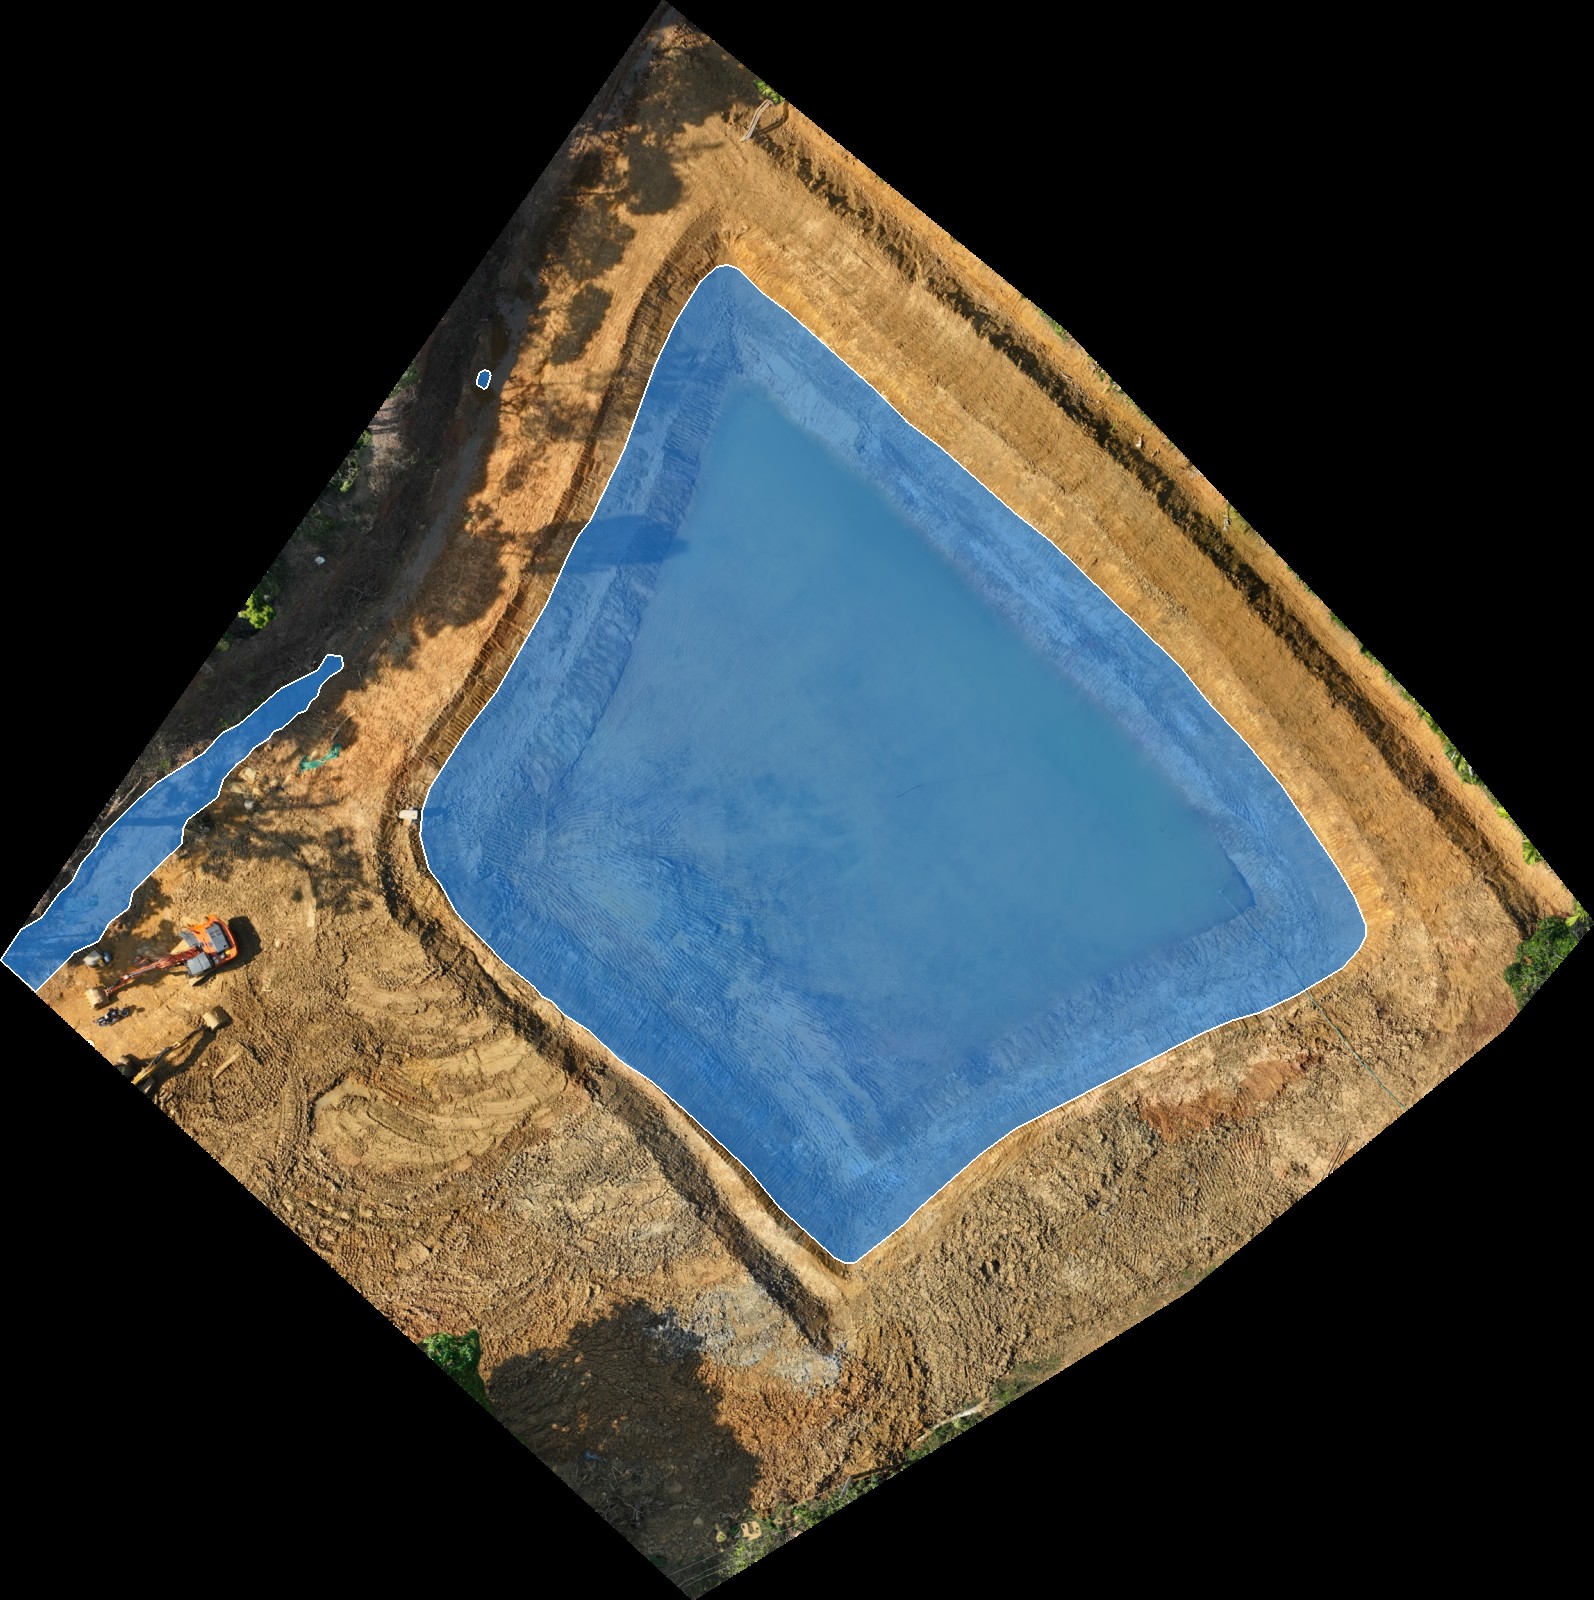
Here’s the result on a real farm pond survey — every pixel at or below 827.5 m turned into a filled polygon, overlaid on the orthomosaic. Notice the second, smaller polygon on the left: a separate low-lying puddle along the access road, picked up automatically as its own feature:
What it does
The generate_contour_level_polygon.py script finds every pixel in the DTM at or below a target elevation and converts those pixels into filled GeoJSON polygons. Multiple disconnected low-lying areas become separate polygon features, sorted largest-first by area.
The geometry is automatically simplified to reduce vertex count and file size. Each polygon gets three attributes: elevation (the target water level), area_m2, and polygon_id.
What you need
- QGIS 3.28 or newer
numpy,rasterio,shapely,pyproj(rasterio and numpy bundled with QGIS; shapely and pyproj may need install via OSGeo4W Shell)- A DTM raster with “dtm” in the layer name, checked in the Layers panel
- The
generate_contour_level_polygon.pyscript from the Drone Mapping, Terrain & Multispectral Analysis QGIS Package
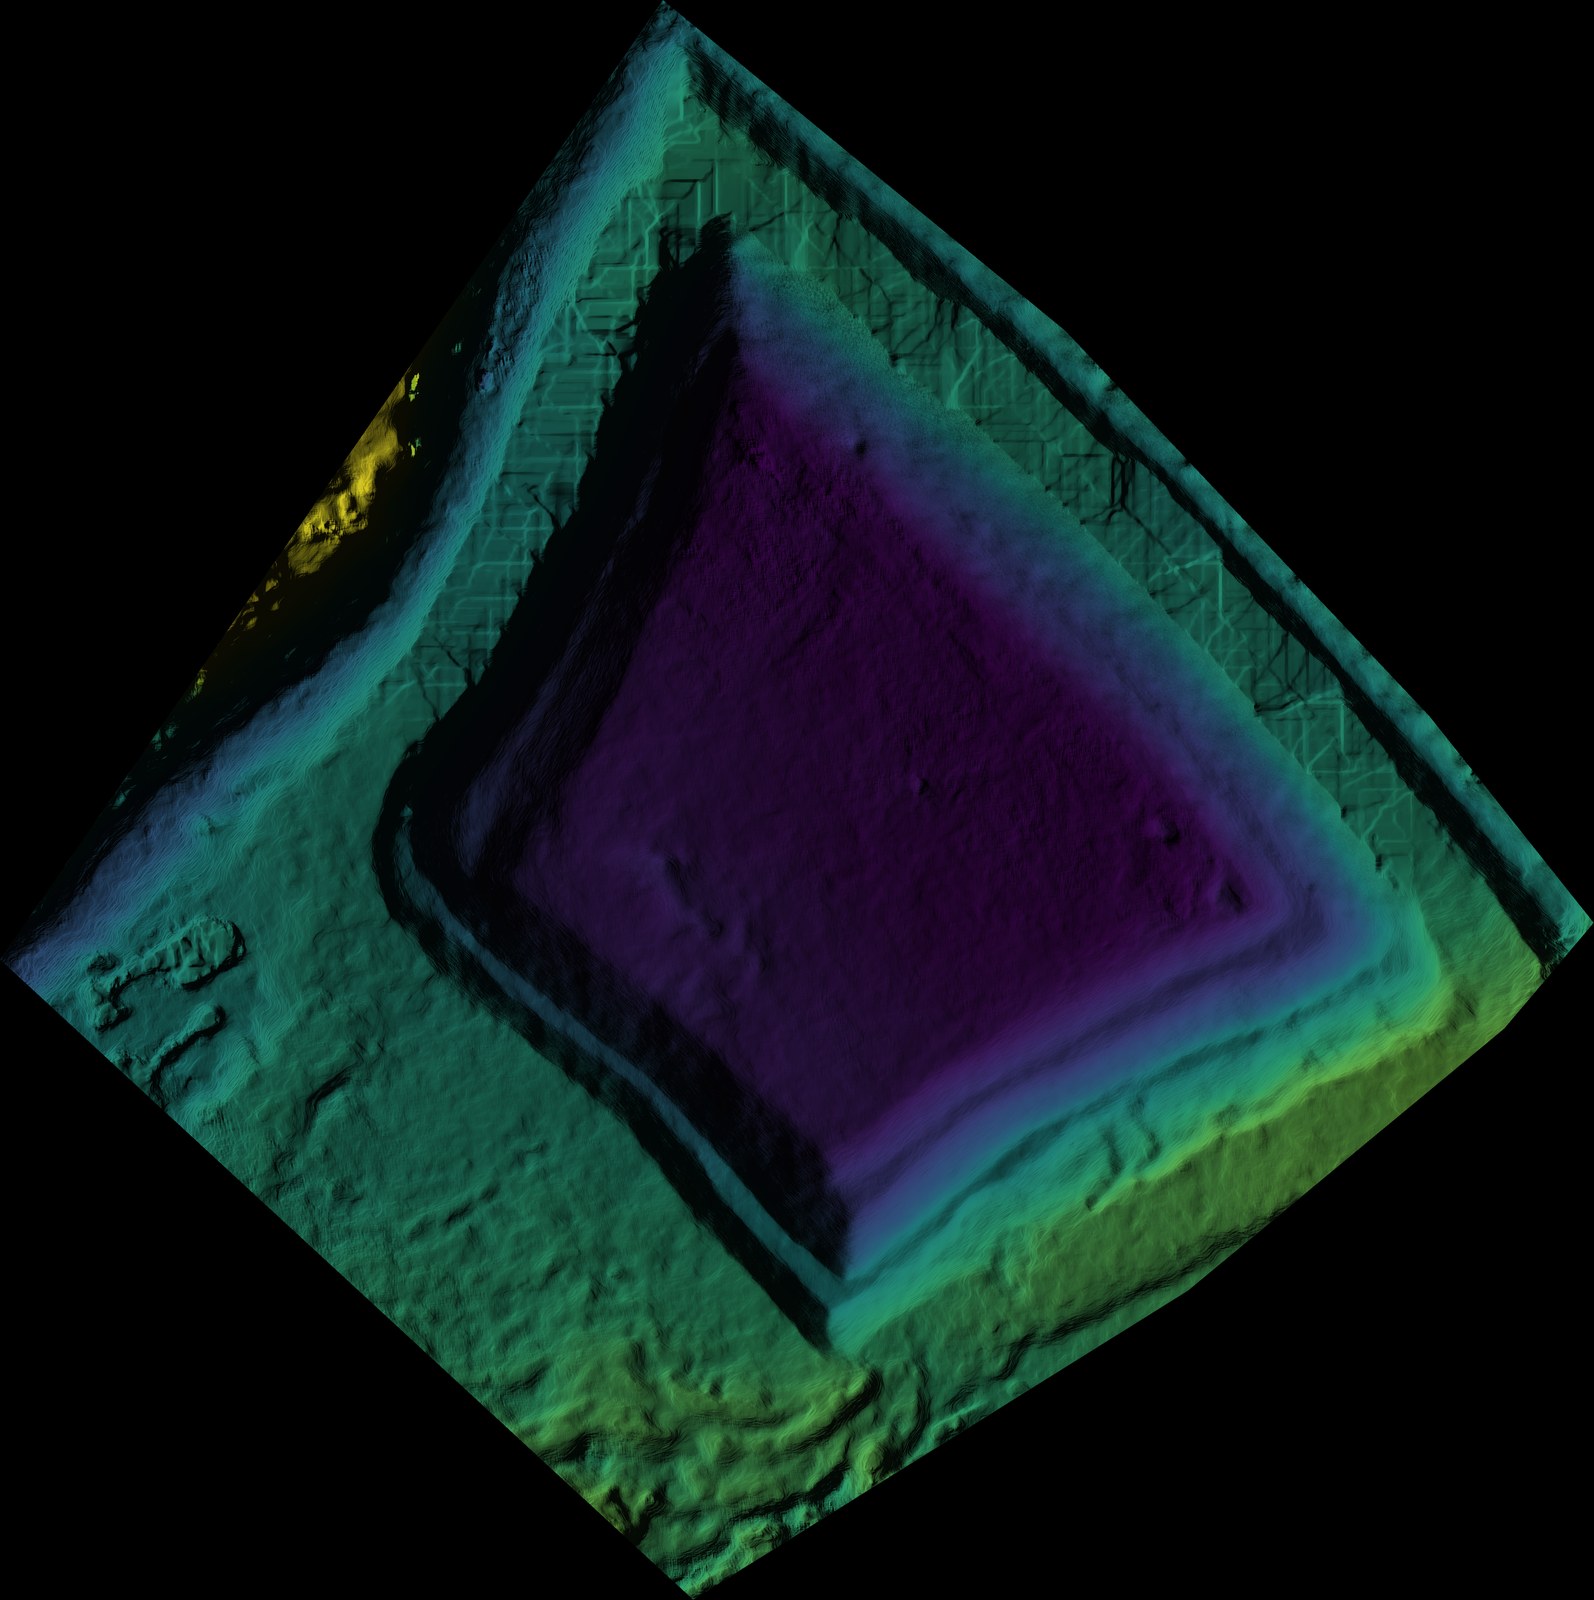
The DTM this script reads, as coloured hillshade — the excavated pond basin clearly visible as the lower (purple) area, matching the polygon shape above:
Steps
- Load your DTM raster into QGIS. Make sure the layer name contains “dtm”.
- Check (tick) the DTM in the Layers panel.
- Open Plugins → Python Console → Show Editor.
- Paste the script. At the bottom, set the
elevationparameter to your target water level in metres (e.g.,elevation=847.5). Optionally adjustsimplify_tolerance(default: 0.5 m). - Click Run.
The output GeoJSON is saved to 2.Session/Geojsons/ in the project directory structure (inferred from the DTM file path) and loaded into your QGIS project.
Configurable parameters
| Parameter | What it controls |
|---|---|
elevation | Target water level in metres (pixels ≤ this elevation are included) |
simplify_tolerance | Polygon simplification in metres — higher = fewer vertices, smoother shape (0 = no simplification) |
min_area | Minimum polygon area in m² to keep — filters out tiny noise polygons. None (default) keeps all, including small ones like the puddle in the example above |
Installing shapely and pyproj
If QGIS reports an import error for shapely or pyproj, install them via the OSGeo4W Shell (Windows) or the QGIS Python environment:
pip install shapely pyproj
Or use the OSGeo4W package manager for a more stable install on Windows.
Related scripts
- calculate_lake_volume.py — computes the actual water storage volume for a specific lake polygon
- generate_contours.py — generates smooth contour lines from the same DTM
Get the script
generate_contour_level_polygon.py is part of the Drone Mapping, Terrain & Multispectral Analysis QGIS Package — all 16 QGIS automation scripts at $99 USD.