

Zonal statistics let you summarise a raster (like NDVI or elevation) within each polygon in a vector layer. Instead of manually clipping rasters to each zone, this script handles the entire operation — including CRS alignment — and writes the result directly to the attribute table.
What it does
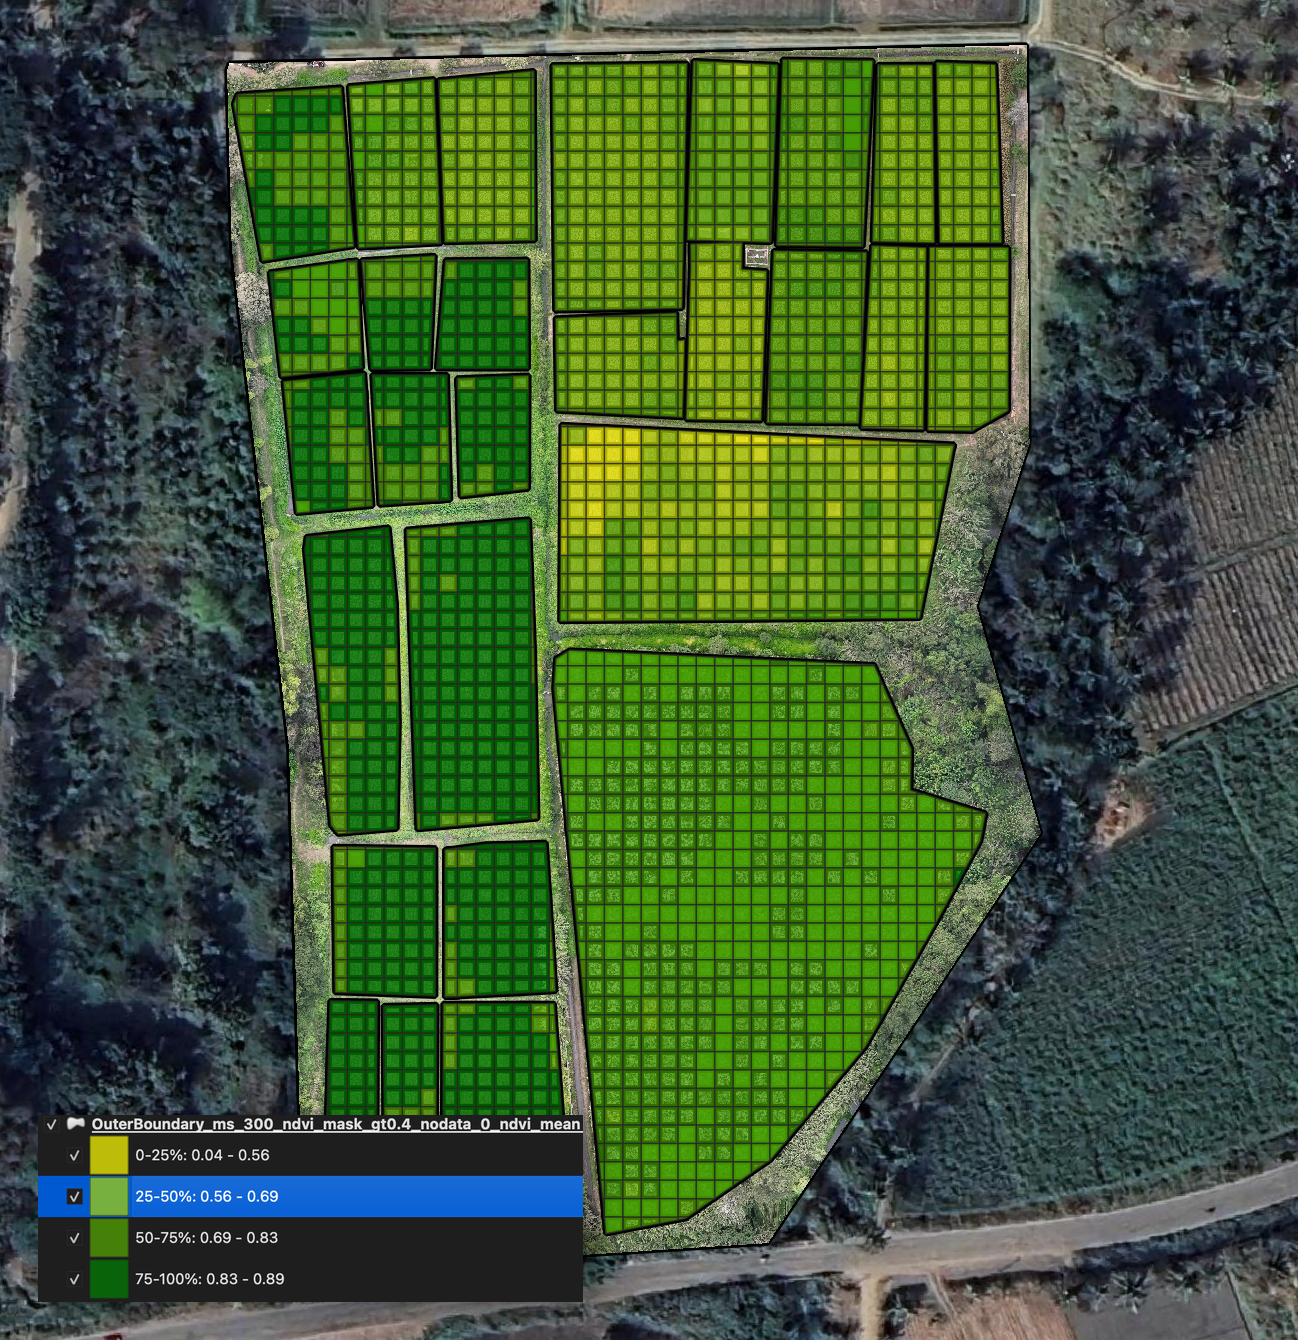
The zonal_statistics.py script computes a summary statistic (mean, median, min, or max) of a raster’s pixel values within each polygon in a vector layer, then writes the result as a new attribute column. The attribute name is {data_type}_{aggregation} (e.g. ndvi_mean, height_max).
If the vector and raster are in different CRS, the vector is automatically reprojected to the raster CRS before sampling.
Output: {raster_name}_{data_type}_{aggregation}.geojson saved in the vector layer’s directory with the new statistics column, loaded into the QGIS project.
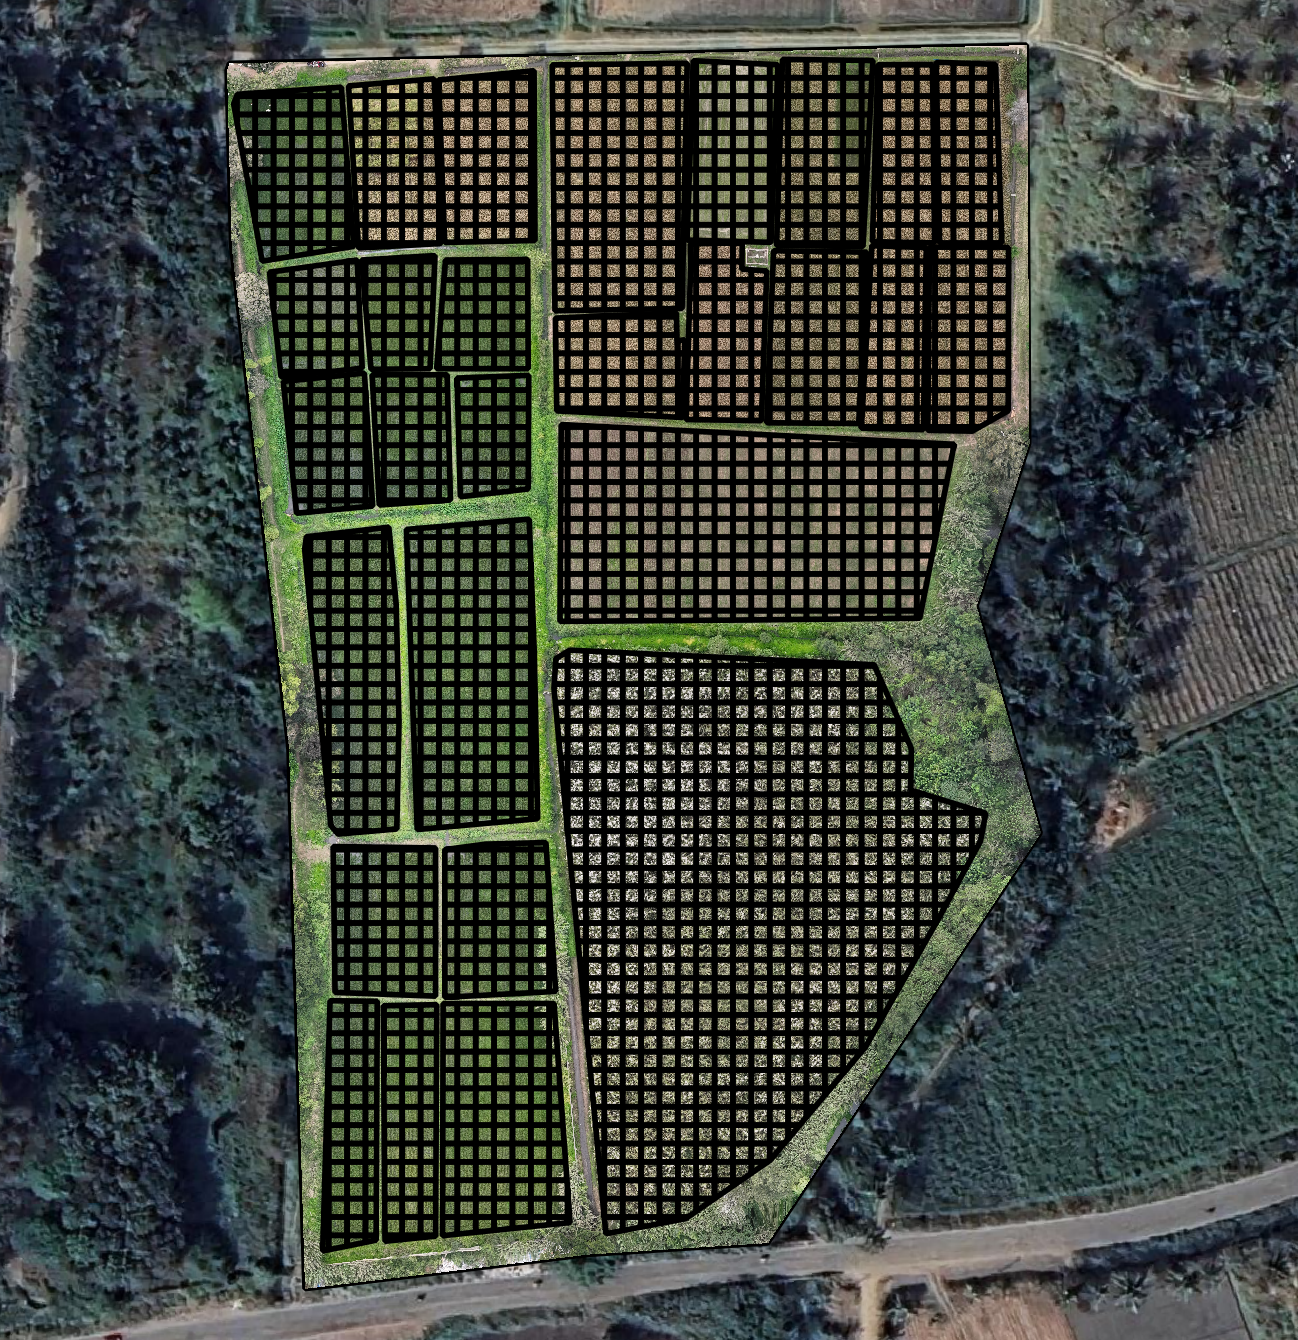
Before — a sampling grid with no statistics attached yet, just geometry:
After — the same grid once zonal_statistics.py has run against an NDVI raster, with ndvi_mean written to every cell and styled by value:
What you need
- QGIS 3.28 or newer
- QGIS processing framework (bundled)
- First checked vector layer — polygon zones (plot boundaries, field parcels, etc.)
- First checked raster layer — any single-band raster (NDVI, CHM, elevation)
- The
zonal_statistics.pyscript from the Drone Mapping, Terrain & Multispectral Analysis QGIS Package
Before you start
Zonal statistics just aggregates pixels into zones you already have — it doesn’t create the zones or prep the raster for you. Two scripts commonly run before this one:
- No polygon zones yet? Use grid_generation.py to lay a rectangular grid of equal-sized cells over your study area — a common way to get evenly-sized “averaging tiles” to run stats over, rather than one stat for the whole field.
- Want to exclude bare soil or noise from the raster first? Run raster_mask_generator.py to threshold the raster (e.g. NDVI > 0.4) before feeding it into zonal statistics, so only the pixels that matter get aggregated.
Steps
- Load your polygon vector layer and check (tick) it in the Layers panel — it must be first.
- Load your raster layer and check (tick) it in the Layers panel — it must be second.
- Open Plugins → Python Console → Show Editor.
- Paste the script. At the bottom, set:
data_type— label for the column prefix (e.g.'ndvi','height','osavi')aggregation—'mean','median','min', or'max'
- Click Run.
Configurable parameters
| Parameter | Example values | What it controls |
|---|---|---|
data_type | 'ndvi', 'height', 'elev' | Prefix for the output column name |
aggregation | 'mean', 'median', 'min', 'max' | How pixel values are summarised per polygon |
When to use zonal statistics vs canopy NDVI
Zonal statistics (this script) samples all pixels inside a polygon — including bare soil. The canopy_ndvi_median_calc.py script samples only canopy pixels by applying a mask first.
Use this script for:
- CHM height statistics per plot
- Elevation summary per zone
- Any raster where bare-ground pixels are meaningful
Use canopy_ndvi_median_calc.py for NDVI where bare soil within the polygon would bias the result.
Get the script
zonal_statistics.py is part of the Drone Mapping, Terrain & Multispectral Analysis QGIS Package — all 16 QGIS automation scripts at $99 USD.