

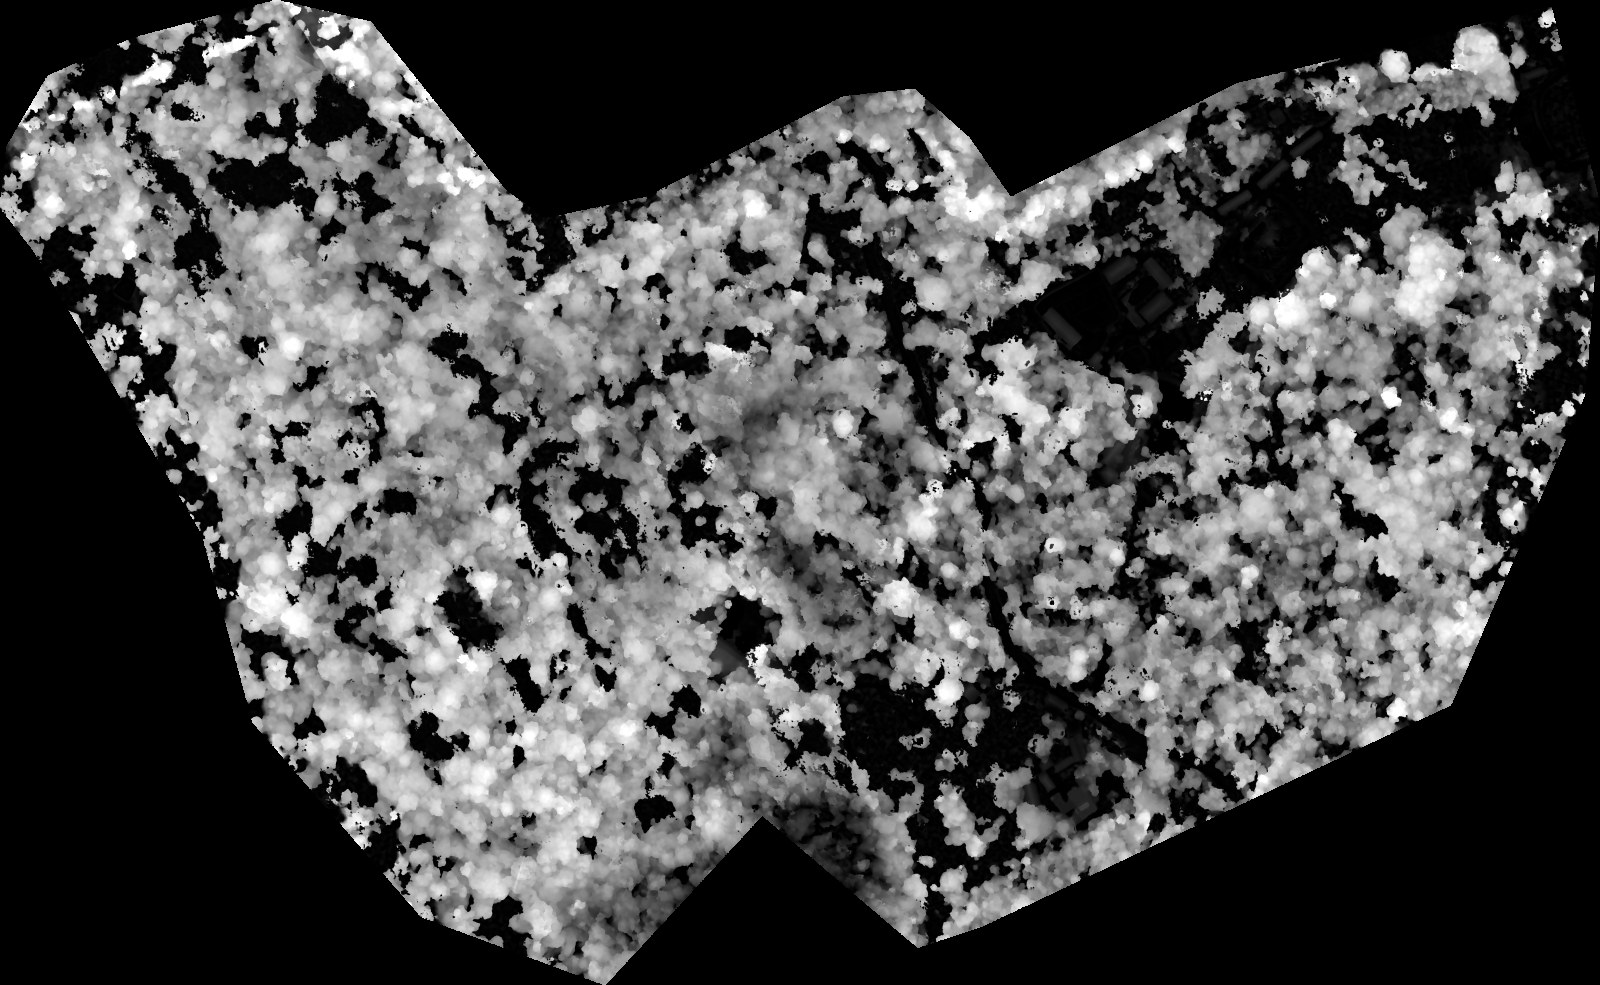
A raw Canopy Height Model (CHM) raster loaded into QGIS shows a grey gradient by default. To make it readable for clients or reports, you need a classified colour scheme with a legend. This script applies one automatically and exports a print-ready JPEG.
Before — the raw CHM, grey gradient, hard to read absolute heights from:
What it does
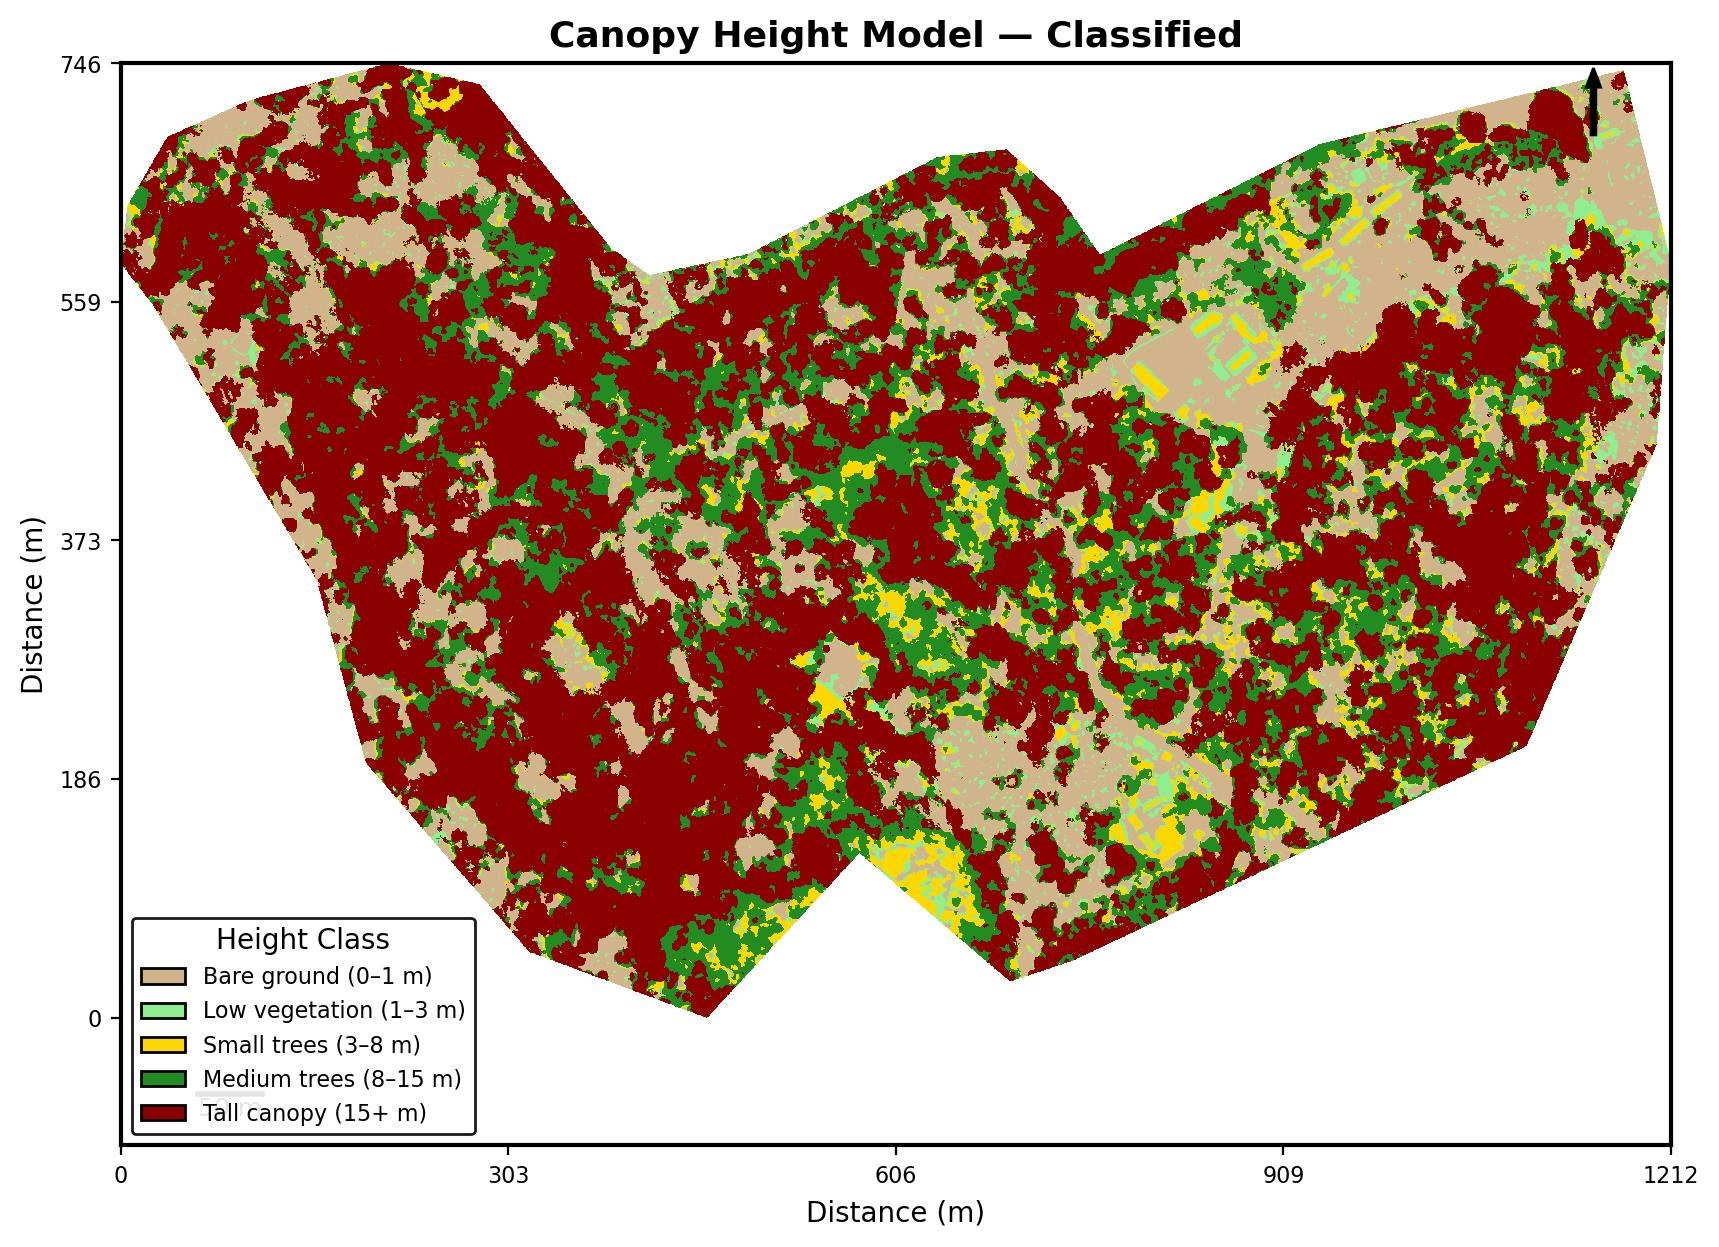
The style_chm.py script applies a classified height-band colour scheme to a CHM raster. Pixels are grouped into five fixed height ranges, each assigned a distinct colour:
| Height range | Colour | Interpretation |
|---|---|---|
| 0–1 m | Tan | Bare ground |
| 1–3 m | Light green | Low vegetation / understorey |
| 3–8 m | Yellow | Small trees |
| 8–15 m | Forest green | Medium trees |
| 15 m+ | Dark red | Tall canopy |
The script also exports a static JPEG map with a legend, north arrow, and scale bar built in — useful for reports or quick sharing without needing Layout Designer. Here’s the real output on a forest estate survey:
Output:
{chm_name}_classified.jpg— static map image{chm_name}_classified.tif— georeferenced classified raster added to QGIS project
What you need
- QGIS 3.28 or newer
numpy,rasterio,matplotlib(matplotlib may need install via OSGeo4W)- A CHM raster with “chm” in the layer name, checked in the Layers panel
- The
style_chm.pyscript from the Drone Mapping, Terrain & Multispectral Analysis QGIS Package
Steps
- Run
generate_chm.pyto create the CHM raster first (see the CHM tutorial). Or load an existing CHM. - Check (tick) the CHM raster in the Layers panel. The layer name must contain “chm”.
- Open Plugins → Python Console → Show Editor.
- Paste the script and click Run.
The classified JPEG and GeoTIFF are saved in the CHM directory. The GeoTIFF is loaded into the QGIS project.
Customising the height bins
The height ranges and colours are defined in the HEIGHT_BINS list inside the script. You can edit them to match the typical canopy heights in your study area — for example, in a low-growing crop plantation the bands might stop at 10 m, while in a mixed forest they might extend to 40 m+.
Related scripts
- generate_chm.py — creates the CHM from DSM + DTM
- tree_heights_from_dsm_dtm.py — extracts per-feature height values from the CHM
Get the script
style_chm.py is part of the Drone Mapping, Terrain & Multispectral Analysis QGIS Package — all 16 QGIS automation scripts at $99 USD.