At Future Thota, we believe that land deserves a new kind of attention — one rooted in precision, stewardship, and sustainability. This walkthrough is a window into how we convert raw aerial data into practical, visual, and decision-ready insights for estate owners and managers.
From Flight to Facts
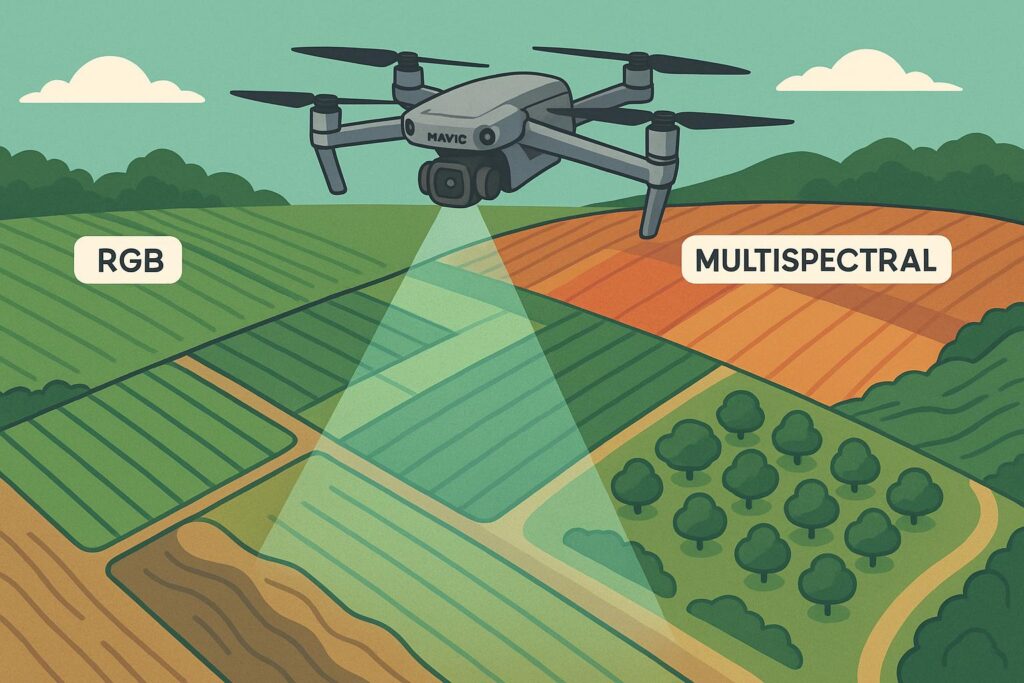
Every survey starts in the sky. Using a multispectral mapping drone, we conduct high-resolution flights over your estate, capturing both RGB and multispectral imagery. This raw data is processed into Digital Surface Models (DSMs), orthomosaics, vegetation indices, and a Digital Terrain Model (DTM) representing the bare earth.
Each mission is customised. Whether it is mapping a coffee plantation on undulating terrain in Coorg, or surveying an agroforestry plot to understand sunlight exposure across blocks, our flight plans are optimised for accuracy, efficiency, and minimal ground disruption.
The Outputs: What the Report Contains
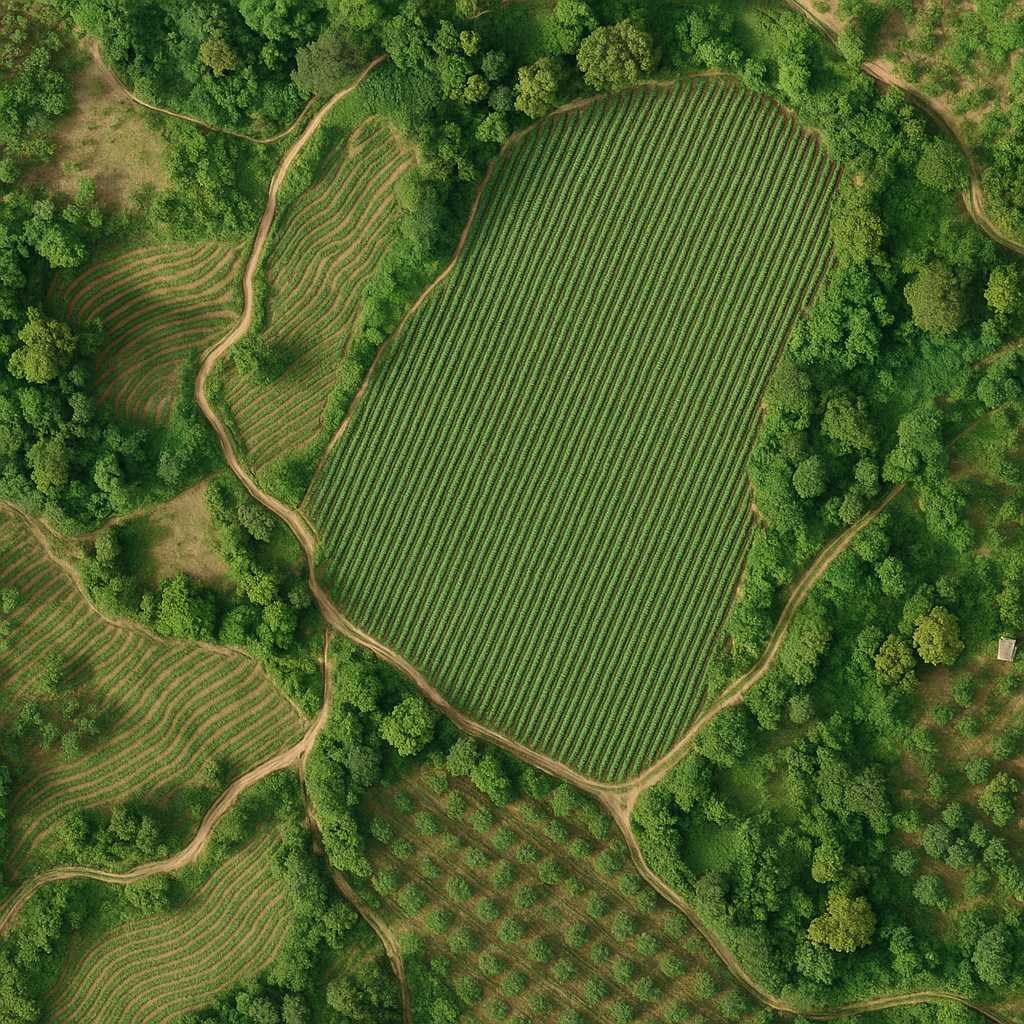
Orthomosaic Overview
A stitched aerial view of the entire estate — the starting point for documentation and planning. At 2–3 cm/pixel resolution, the orthomosaic captures detail that is impossible to see from the ground. Tree lines, paths, water bodies, and plantation block boundaries all become clearly visible.
Use it for: visual documentation, boundary verification, and as a reference layer for all other analysis.
Digital Terrain Model (DTM)
Shows the elevation variation of the bare earth surface across the estate — with all vegetation and buildings removed. The DTM is used to understand slope, identify drainage paths, and plan irrigation infrastructure.
Use it for: drainage planning, irrigation line routing, identifying erosion-prone slopes, and slope-corrected area calculations.
Slope-Corrected Area Calculations
On hilly coffee estate terrain, a planar area measurement from above significantly underestimates the true planted surface. We compute slope-corrected area by applying a per-pixel correction factor derived from the DTM gradient. This produces the true surface area — the number that matters for yield estimation and acreage billing.
Use it for: accurate estate area records, yield benchmarking, and land documentation.
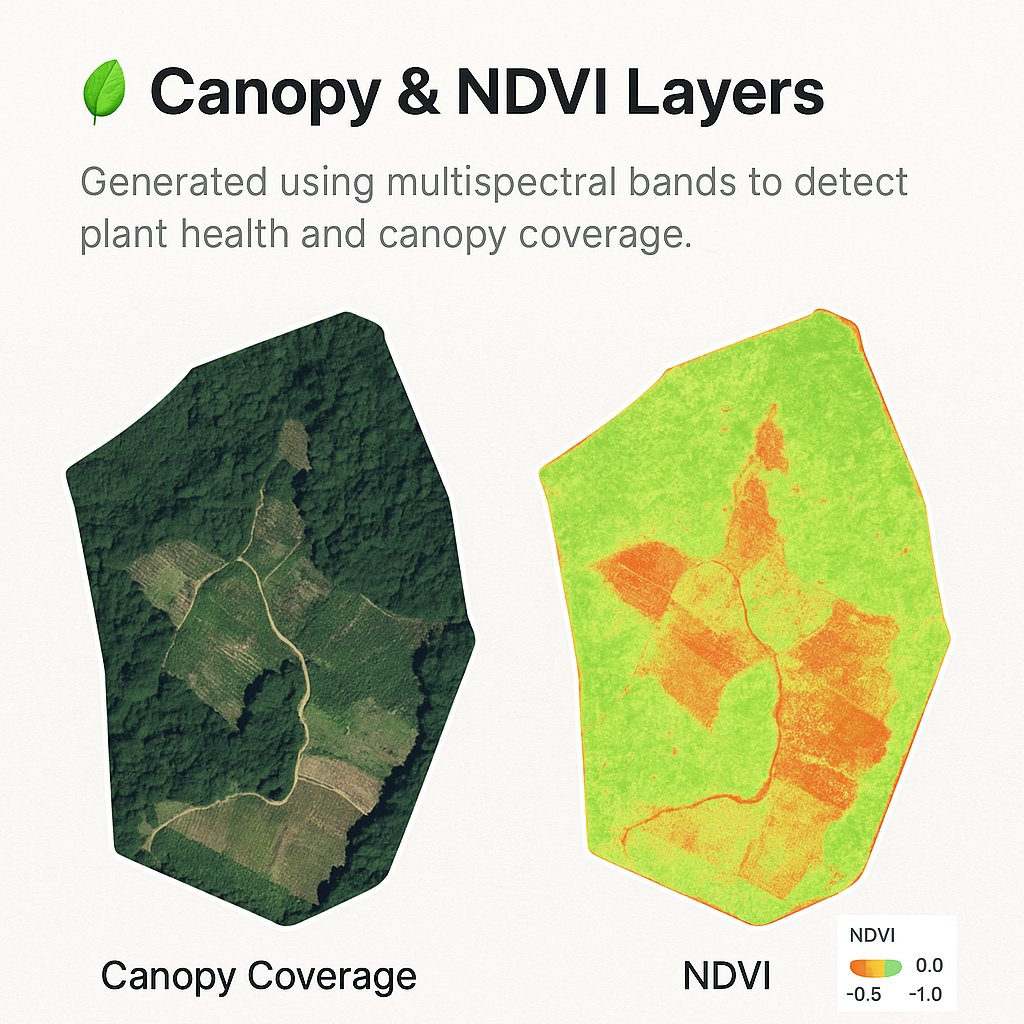
Canopy and NDVI Layers
Generated from multispectral image bands, the NDVI (Normalised Difference Vegetation Index) map shows vegetation health across the estate. Values range from near zero (stressed or bare ground) to 0.9 (dense, healthy canopy).
- High NDVI (green) — Healthy, photosynthetically active canopy
- Low NDVI (yellow/red) — Stressed vegetation — potential water deficit, disease, or soil issue
The NDRE (Red Edge index) provides additional sensitivity to chlorophyll content, useful for late-season stress detection.
Use it for: identifying underperforming zones early, planning targeted interventions, tracking health changes season over season.
Sunlight Exposure and Hillshade
Derived from the DTM, the hillshade and solar irradiance models show which parts of the estate receive more sunlight across the day. For shade-grown coffee, this directly informs shade tree management decisions.
Use it for: shade lopping decisions, selecting blocks for trial plantings, understanding yield variation by aspect.
Advanced Custom Analysis

Depending on the estate’s needs, we offer additional analysis layers:
- Tree Count and Health Monitoring — Individual canopy classification for high-value shade tree management
- Water Flow Simulation — Drainage path modelling from the DTM for irrigation and erosion planning
- Boundary Verification (GPS KML) — A GPS polygon of the estate boundary for records and future surveys
- Annual Change Detection Reports — Year-on-year comparison of canopy health and coverage
All layers are geo-referenced and provided in GeoTIFF format, compatible with QGIS, Google Earth, and other GIS platforms.
What You Receive
After every survey mission, you receive:
- A cloud drive folder with all map files in GeoTIFF and high-resolution JPEG format
- A printable, shareable PDF report summarising the findings for non-technical stakeholders
- An optional consultation session to walk through the findings and discuss next steps
Everything is specific to your estate and your needs. Not generic outputs — real data from your land, with insights that reflect your terrain, your crops, and your management context.
Drone Mapping as Land Stewardship
Drone mapping is not just about generating maps. It is about equipping landowners with the tools to make better decisions — whether that is planning an irrigation system, deciding where to replant, identifying a disease outbreak early, or simply understanding the terrain in a way that 30 years of walking the land has not made obvious.
At Future Thota, our mission is to support land stewardship through precision technology. This report is one step in that journey.
For further reading:
- Drone Mapping Checklist — preparation for a successful survey
- Drone Survey in Coffee Plantations — altitude case study
- What You Receive from a Survey — full deliverables breakdown
To book a survey for your estate in Coorg, Chikmagalur, or elsewhere in South India, contact us.